
Cocoa Commodity - Elliott Wave Technical Forecast
Cocoa Elliott Wave Analysis
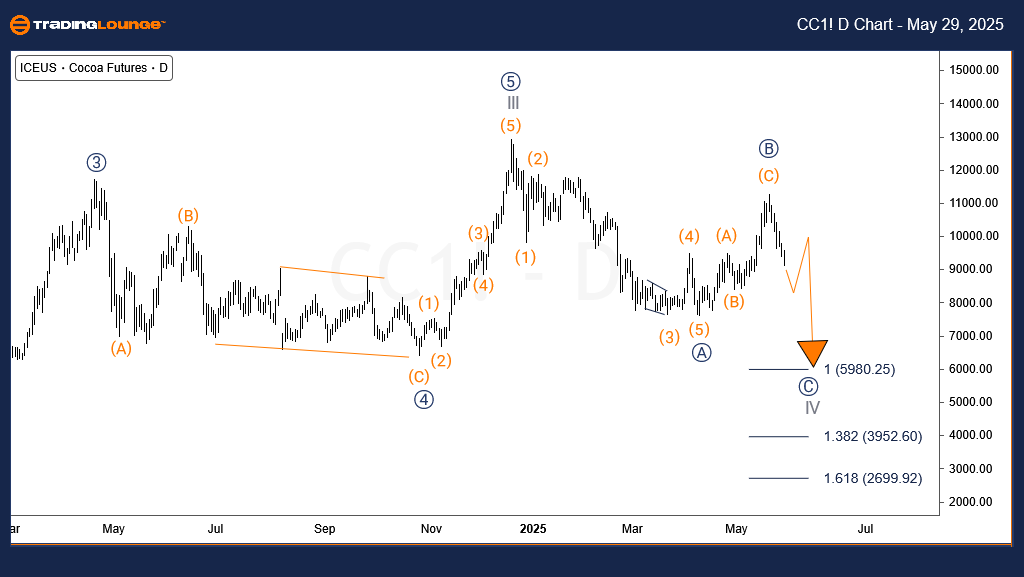
Cocoa prices are sharply falling in late May, giving up most of the gains made earlier in the month. This suggests that the downward trend starting from December 2024 is continuing. If the May high holds, prices could move down toward 5980 in the next few weeks. According to the Elliott Wave pattern, this move is a correction of the 5-wave rise that started in June 2020.
Cocoa Long-Term View and Daily Chart Analysis
Cocoa has been in a long-term upward trend since May 1992. The first major wave, labeled ((I)), ended in March 2011. After that, wave ((II)) pulled back and finished in March 2017. From that point, wave ((III)) began rising. The sub-wave III of (III) of ((III)) peaked in December 2024. A pullback labeled wave IV began from this high. Wave ((A)) of IV completed a 5-wave pattern in April 2025. This was followed by a zigzag pattern for wave ((B)), which ended on May 20, 2025. The price is now expected to continue falling in another 5-wave pattern, targeting the 5980 to 3952 range
Cocoa H4 Chart Analysis
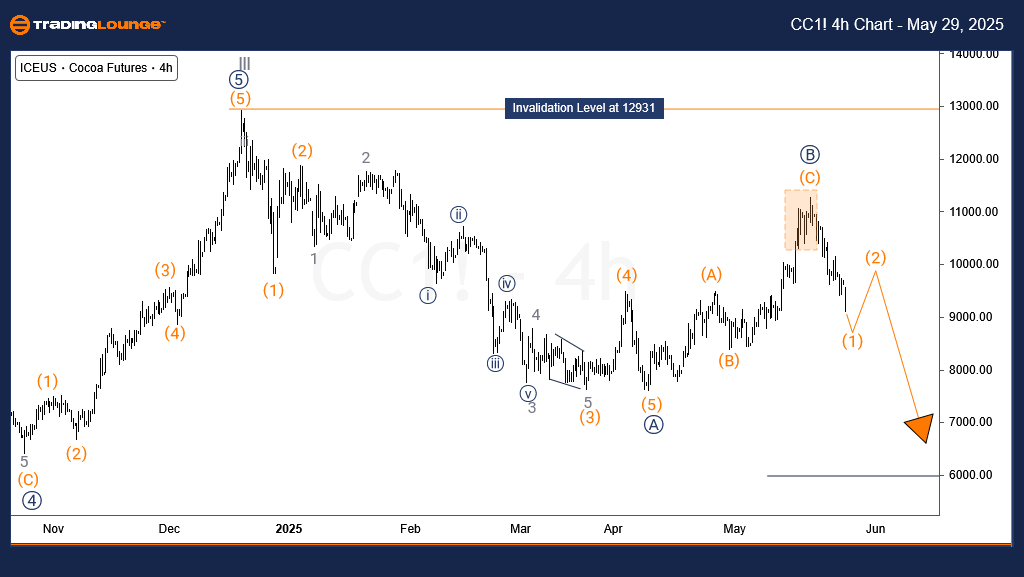
The H4 chart shows wave ((B)) ending at the upper resistance zone, which gave sellers a chance to enter. The price is now in wave (1) of ((C)) and likely to drop more with short-term rebounds. As long as the price stays below the May 20 high, the trend is expected to continue downward, aiming for 5980 in the coming sessions.
Technical Analyst: Sanmi Adeagbo
More By This Author:
Elliott Wave Technical Forecast: Newmont Corporation - Thursday, May 29
Elliott Wave Technical Analysis: CSX Corp. - Thursday, May 29
Elliott Wave Technical Analysis: Euro/British Pound - Thursday, May 29
At TradingLounge™, we provide actionable Elliott Wave analysis across over 200 markets. Access live chat rooms, advanced AI & algorithmic charting tools, and curated trade ...
more

