Clean Energy Versus Oil & Gas
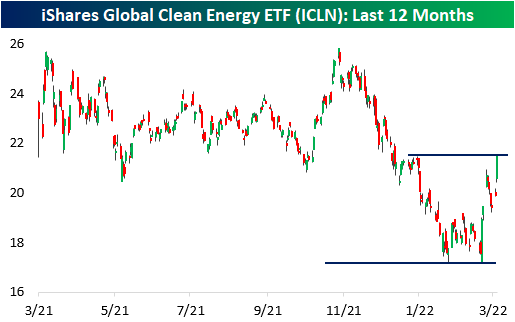
As the Russia-Ukraine conflict escalates and western nations apply economic pressure on Russia (one of the world’s largest producers of oil & natural gas), the market for energy-related commodities has become extremely tight. The current energy crisis has shown investors the downside of being reliant on other countries, especially ones they aren’t friendly with. In our current economic setup, For example, it would be nearly impossible to phase out Russian oil for the majority of western nations, but technological innovation and increased adoption of clean energy can change the balance which is why alternative energy stocks have caught a bid. For example, the iShares Global Clean Energy ETF (ICLN) has rallied 17.8% since Russia invaded Ukraine, thus wiping out the previous 17% YTD decline.
There are two ways to view the correlation between clean energy stocks and the price of energy. As the price of oil rises, the attractiveness of alternative energy sources increases for consumers, enterprises, and governments alike. Therefore, following this logic, one could expect a moderately positive correlation between the two. On the other hand, increased adoption of alternative energy decreases the demand for oil, which will suppress the value of energy commodities and lead to gains for clean energy stocks.
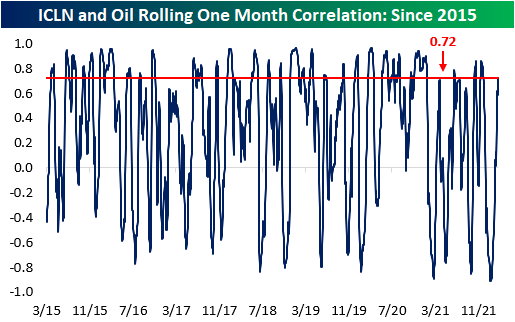
Since ICLN began trading in February of 2015, the ETF and the front-month WTI crude oil contract have had a correlation coefficient of 0.35, which signifies a moderately positive relationship. However, this correlation is far from constant. Granted, there are many other factors besides oil prices (like government legislation and valuations) that affect the stocks in the ICLN ETF, but currently, the one-month correlation between the two assets is relatively strong at 0.72, which is especially notable since this figure hit a record low of -0.91 on 1/26.
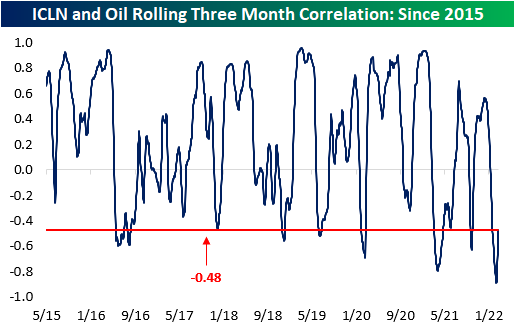
On a rolling three-month basis, the correlation coefficient between the two assets is still compressed compared to historical averages. Since the launch of the ETF, the average three-month correlation between ICLN and oil has been 0.24, but this figure hit an all-time low of -0.89 two weeks ago on 2/25. This measure has started to move higher in the last few sessions, but the current level is still low relative to history. In fact, the correlation coefficient on a three-month basis has only been lower than current levels 8.5% of the time since 2015..
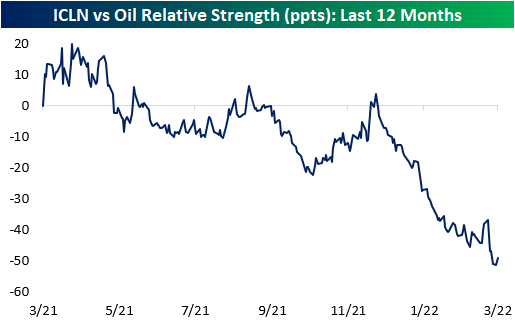
The chart below compares the relative strength of ICLN versus oil over the last year. In the chart, a rising line indicates that ICLN is outperforming oil and vice versa. As you can see, oil has been significantly outperforming ICLN over the last year. Additionally, excluding the COVID craziness when oil turned negative for a day in April 2020, the rolling one-year relative strength is near all-time lows (second chart).