
“Chip Shot” Stock Market (And Sentiment Results)
As I shared on recent podcast|videocast‘s, I started playing golf again after many years. My swing has come back – so now it’s just putting the time in. But to really score, I’m going to have to work on my short game aka chipping and putting to get my feel back.
This is of critical importance as “chips” are the key to the economy/inflation moving forward. They are also the key to one of our major new positions in an auto-supplier – which is dependent upon OEMs finally receiving the chips they need to fulfill the unprecedented demand and back-orders for new cars. We have given easy hints on recent podcast|videocast‘s as to which company.
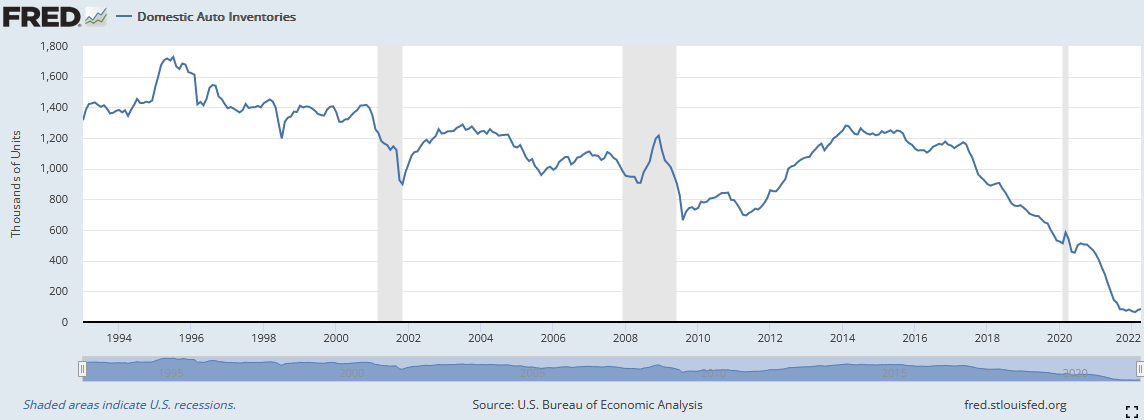
Dealer lot inventories are still at 10-15% of where they need to be. This is not for lack of DEMAND. It is due to lack of supply of chips. This could be changing very soon. Yesterday’s shortage will be tomorrow’s glut! We wait with bated breath:
(Click on image to enlarge)
-Adam Jonas of Morgan Stanley came out with a note this week which indicates that the long-lasting global auto chip shortage is edging closer to resolution.
-TSM (which accounts for ~50% of global auto MCU production) has seen significant improvements through 1Q with wafer foundry auto semi output up approximately 60% YoY.
-Jonas stated “Our Greater China semis team is highly confident that current semiconductor supply is sufficient to bring up auto production.” This should result in lower used vehicle prices since “Used vehicle prices are still up over 60% vs. 2 years ago and only 6% off of all-time high. Recovering new car supply/inventory can be a release valve for unprecedented new and used car price inflation.”
-Used cars and energy have been the two key components driving up inflation over the past year. If used car prices roll over, this will have a meaningful impact on inflation reads in the coming months.
On Wednesday, I joined Seana Smith and Dave Briggs on Yahoo! Finance to discuss my latest Stock Market outlook. Thanks to Seana, Dave, Taylor Clothier and Kristen Tsoubanos for having me on.
What happens with inflation will impact what the Fed does in the coming months. If inflation continues to support the “peak” narrative with continued declining prints, the Fed can “pivot” to a more dovish stance by late summer. If inflation persists, they will tighten the economy into recession.
Here are some key points we hit on with our show notes for Yahoo! Finance:
COMMODITIES:
Good: Cocoa, Coffee, Lumber, Copper, Lean Hogs, and Soybean Meal have been weakening in recent months. We covered this in last week’s note:
Bad: Oil has been stubbornly high due to Russia/Ukraine premium – and more recently China Re-Opening.
Light at End of Tunnel: Oil is in backwardation which signals relief may be in sight. CASH: $114.67 Dec 2023: $86.96 Dec 2024: $78.40
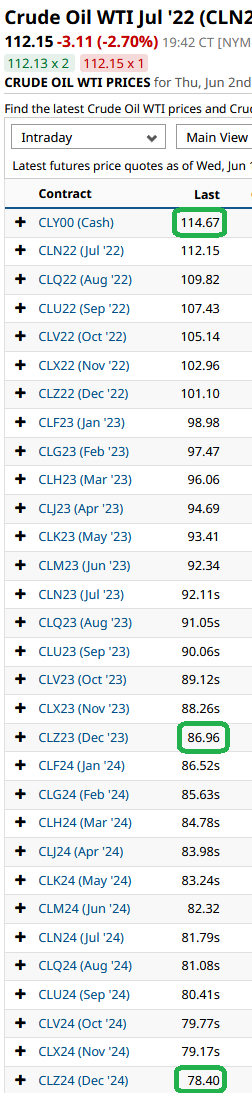
Barchart
Rig Count approaching pre-pandemic levels of 792 (currently 727). Bottomed at 244 in August 2020 (up 197%). Supply will come with or without OPEC.
(Click on image to enlarge)
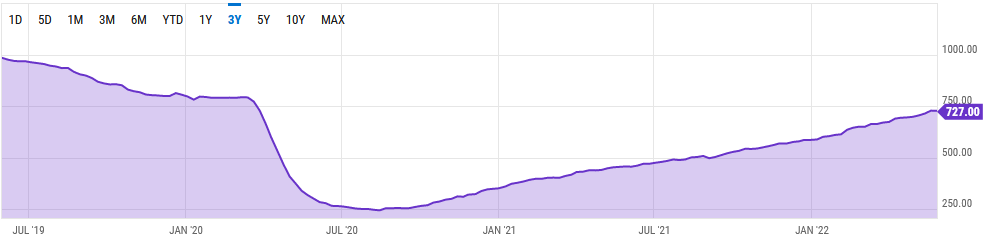
ycharts
-Oil prices turned negative on Tuesday after a report that some producers were exploring the idea of suspending Russia’s participation in the OPEC+ production deal.
-The suspension of Russia from OPEC+ could be a precursor to Saudi Arabia and the UAE utilizing their spare production capacity, since they no longer have a production quota agreement that needs to account for Russia’s interests.
Fed:
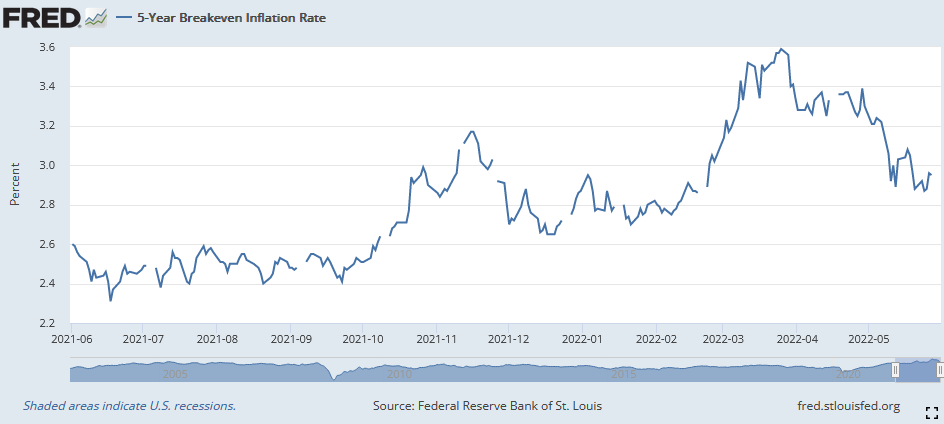
-With Commodities (ex-energy) coming down in recent months, inflation expectations (which is what the Feb emphasized in their recent minutes) are rolling over.
5-year inflation breakevens have come down from 3.59% on March 25, 2022, to 2.96% today. If this trend continues it will give the Fed cover to pause or reduce hikes from 50bps per meeting to 25bps in the Fall.
(Click on image to enlarge)
10-year breakevens had the biggest monthly drop since March 2020:
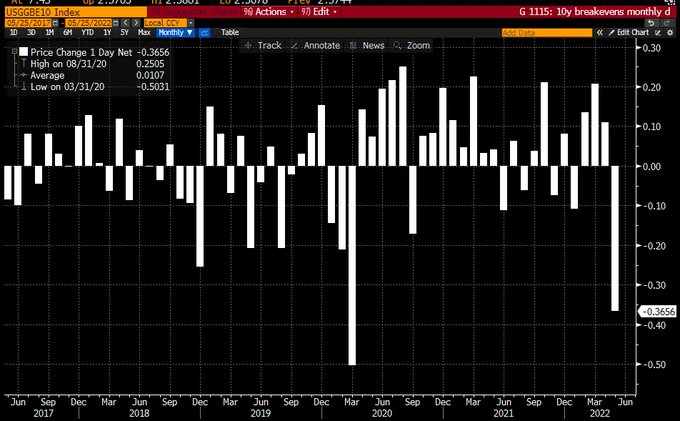
Katie Greinfeld via Bloomberg
–Port Backups in LA have more than halved in the last couple of months.
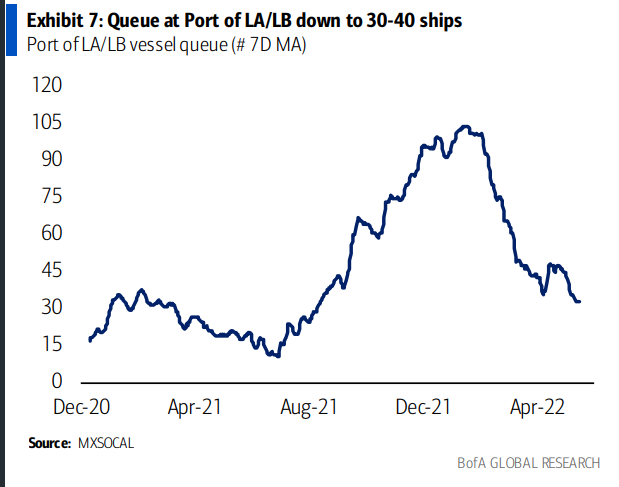
BofA
-Used cars and energy have been the two key components driving up inflation over the past year. If used car prices roll over (per the Morgan Stanley note referenced above), this will have a meaningful impact on inflation reads in coming months.
May CPI numbers which come next week should support the “peak” narrative due to high “base effects.” In other words, May of 2021 was one of the biggest jumps in inflation and comps will be high so the percentage increase should drop.
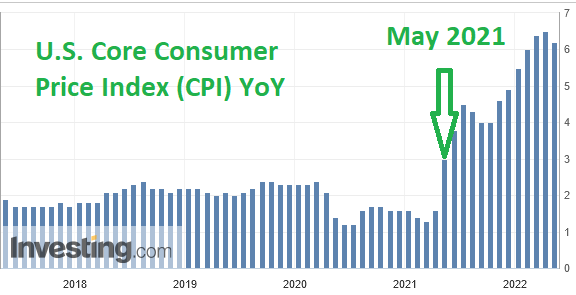
This favors the possibility of a “dovish pivot” by the Fed as early as late Summer.
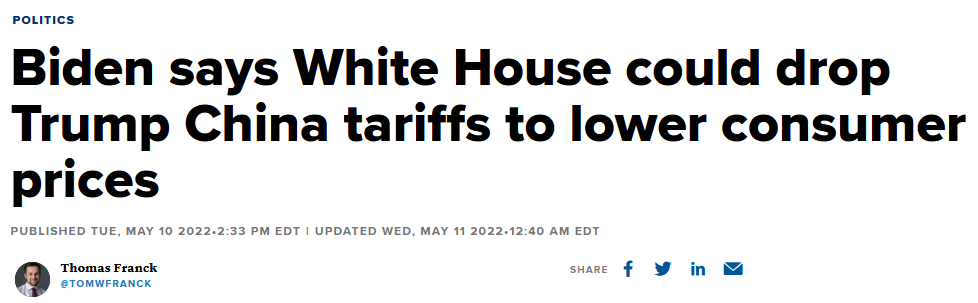
One more headwind that could become a tailwind – as it relates to prices – is a policy change being contemplated by the current administration:
Additional Show Notes:
Time to buy selective high-quality companies and sectors trading at deep discounts due to rates and tightening fears.
Follow Warren Buffett:
Warren Buffett put ~1/3 of his cash hoard (approximately ~$50B) to work since the beginning of the year. While others were puking, Warren was shopping.
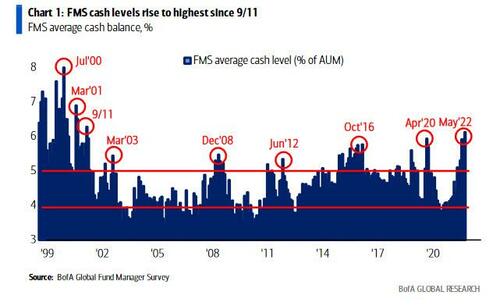
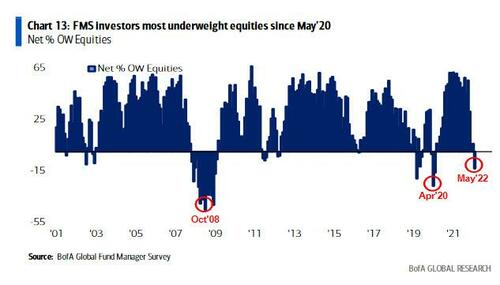
SENTIMENT: May BofA Global Fund Manager Survey
-Managers had the highest cash balances since 9/11 in 2001 & GFC.
–Most Underweight stocks since April 2020
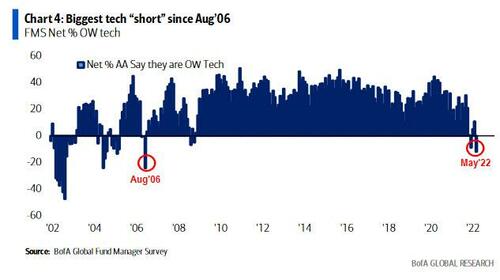
-Too Crowded: Biggest tech “short” since August 2006 (Rallied 42% next 1.5yrs)
–Most Crowded Trades: Long Oil/Commodities (28%), Short 10y Tsy (25%)
OUTSIDERS VS. INSIDERS
-GS NOTE shows retail investors have sold all of the stocks they purchased during the pandemic. (i.e. they sold in the hole).
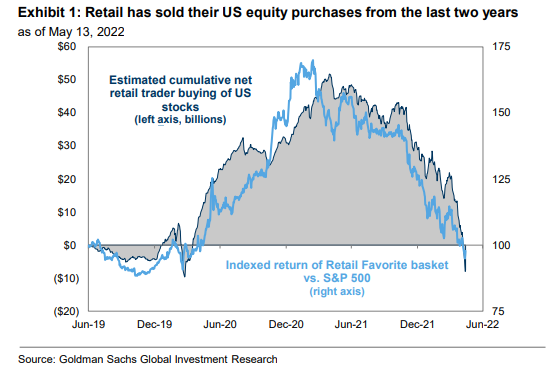
Goldman Sachs
-At the same time, INSIDER BUYING is the highest since the pandemic lows when executives were buying their own stock at record clips.
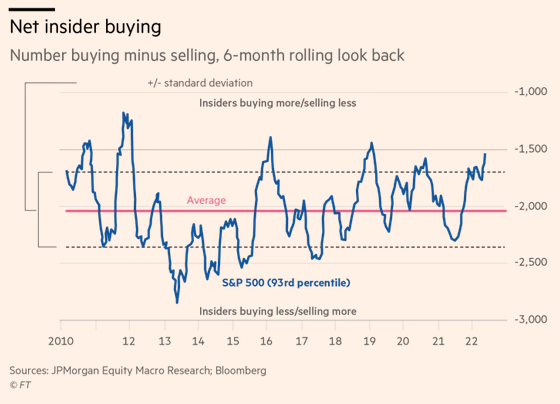
So retail – with no direct knowledge – sold everything in recent months, while insiders – with perfect market knowledge about their own businesses – are buying everything on clearance.
BUYBACKS & REBALANCING:
-Companies have announced $429B of buybacks since the start of 2022, stronger than 2019 and 2021.
-Q1 Buybacks were up 45% you led by technology.
-$250 billion could flow into stocks by the end of June as pension funds and sovereign-wealth funds “re-balance” by buying stocks.
NO SELLERS LEFT?
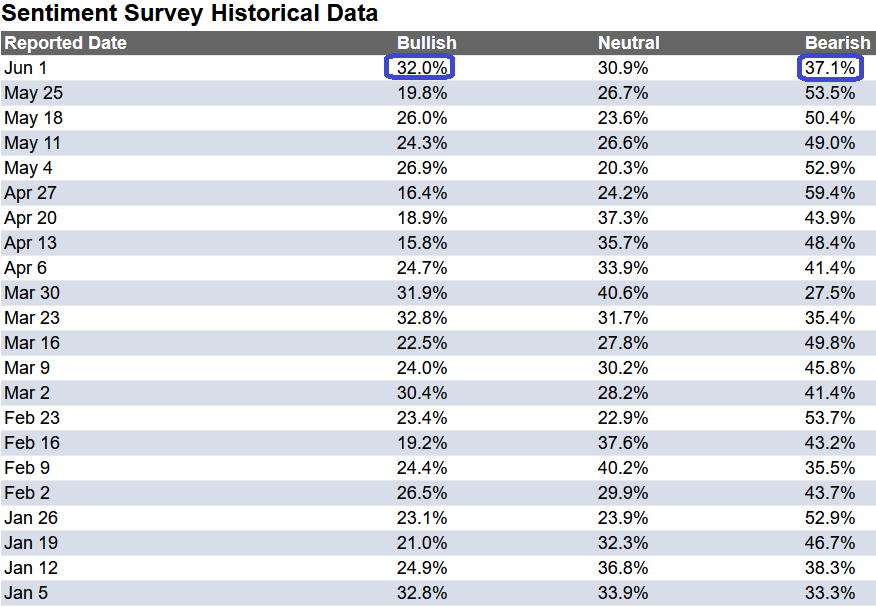
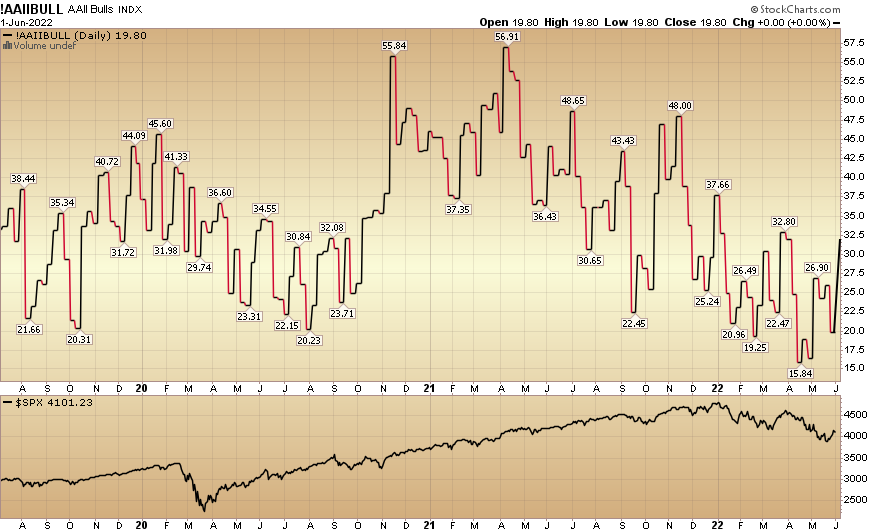
AAII Sentiment Survey – 53.5% bearish last week (pandemic lows was ~52.6%)
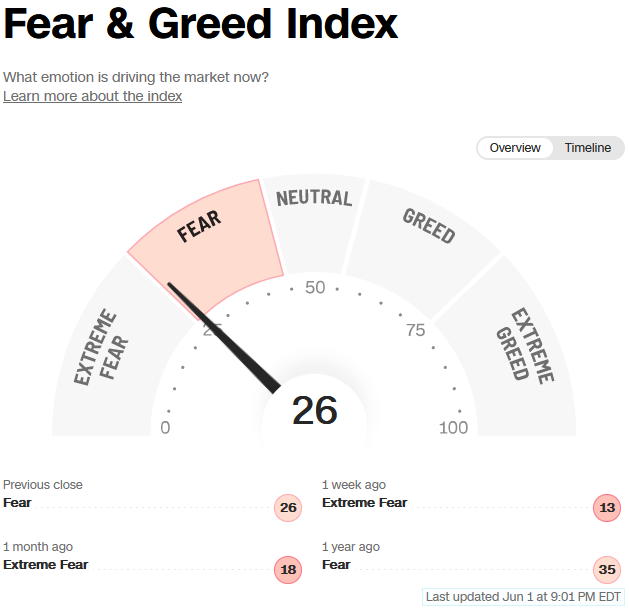
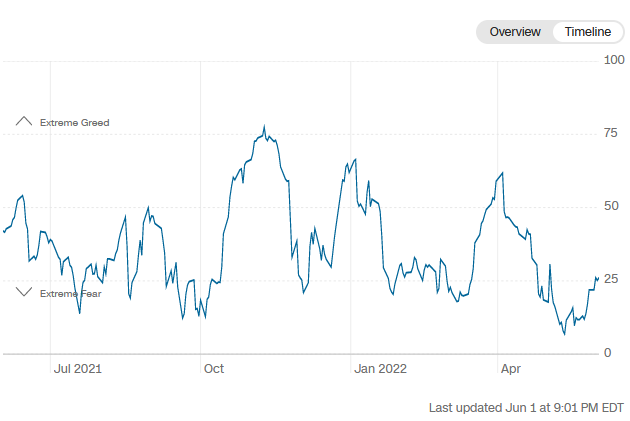
CNN Fear and Greed is at 25 (Still Extreme Fear)
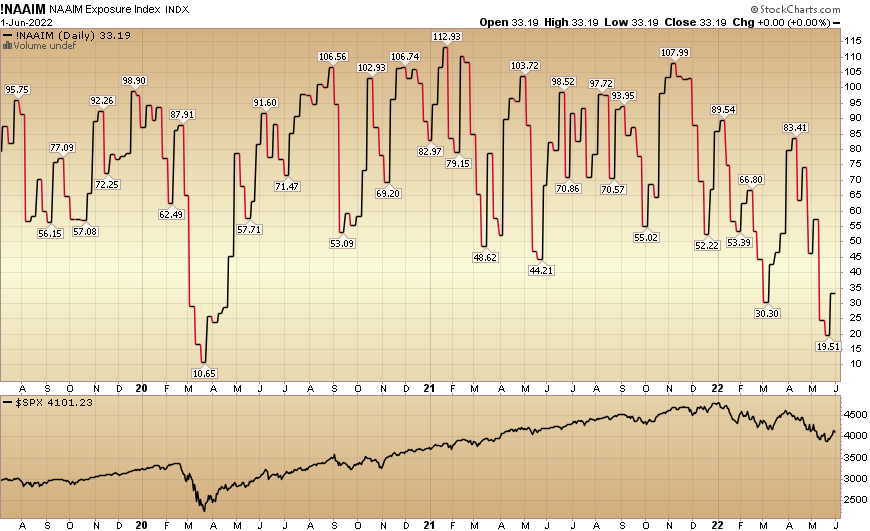
NAAIM: Equity exposure 2nd lowest point since 2020 lows – 33.19%
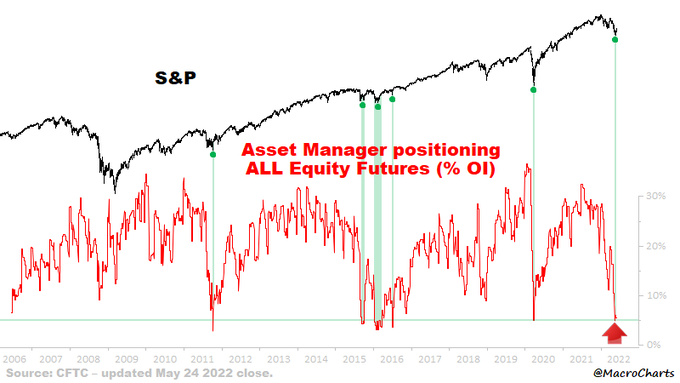
@macrocharts on twitter
Bank of America via isabelnet
RELIEF MAY BE IN SIGHT
-Much of the selling in recent weeks was “forced selling” unnatural margin calls and fund redemptions from people who had too much leverage.
-Melvin Capital’s letter to investors that he was closing down two weeks ago may have marked the bottom. Between his $7.8B fund and Tiger Global losing $17B on its tech holdings, much of the pain may now be in the rearview mirror.
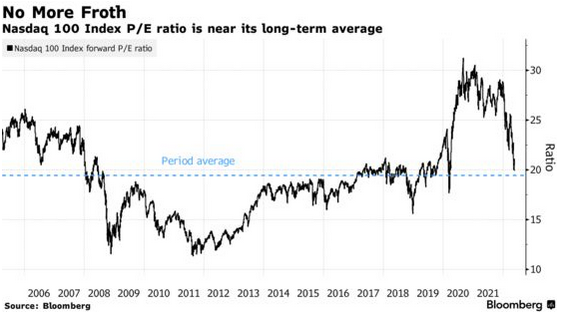
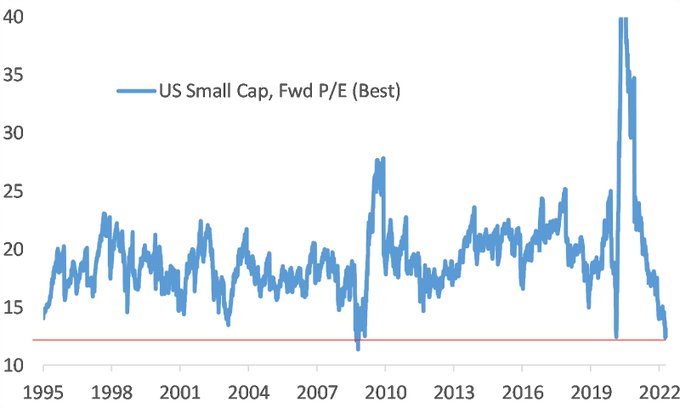
EARNINGS/MULTIPLES
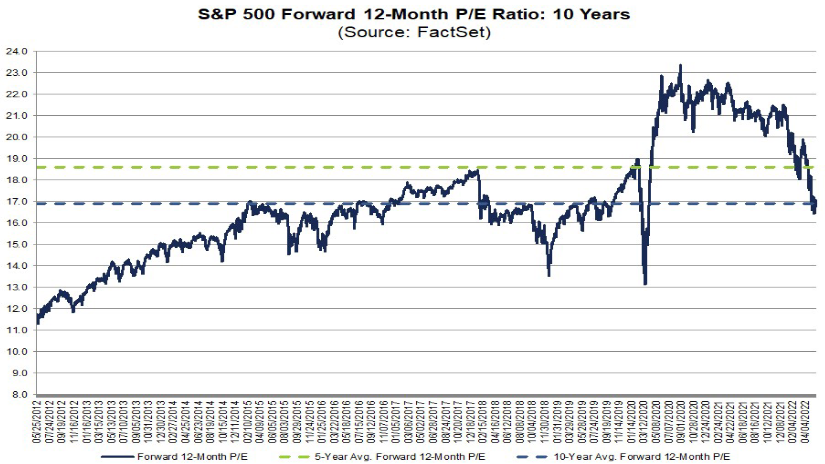
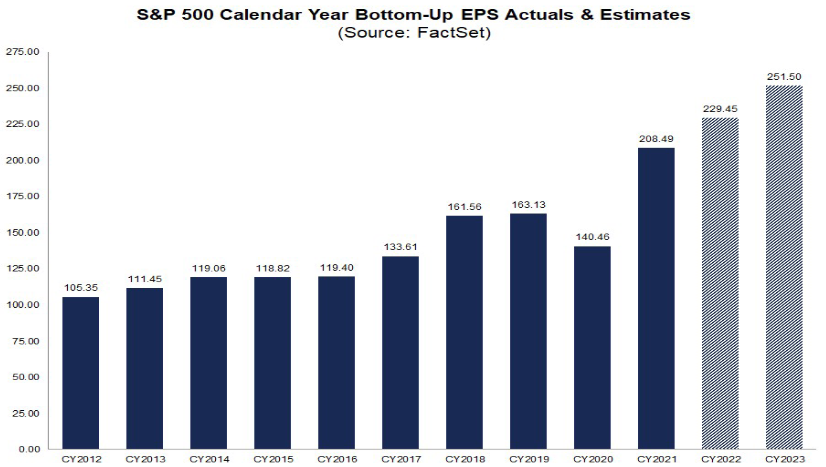
-The 5yr average multiple on the S&P 500 (WHICH INCLUDES THE LAST TIGHTENING CYCLE) is 18.6x. We are currently trading at 18x 2022 EPS and 16.4x 2023 consensus EPS. Could multiples go lower? YES, but rates would have to go higher to justify that magnitude of multiple contraction. Rates (10yr yield) were 6.82% in 2000 BIG DIFFERENCE TO NOW.
JP Morgan
-While we did spike up to ~3.20% on the 10yr for a few minutes several weeks back, it is consistent with the peaks in October 2018 of 3.25% and Jan 2014 at 3.03% – before receding aggressively.
FEAR OF TIGHTENING IS WORSE THAT TIGHTENING ITSELF (2 examples):
-2015-early 2016: 2 sectors were DECIMATED in ANTICIPATION/FEAR OF THE TIGHTENING CYCLE that started in 2016: China Tech and Biotech.
-Alibaba (BABA) sold off 53%, and Biotech (XBI) sold off 52% in the 12 months ahead of the hikes (2015).
-After the first rate hike in December 2015, both Biotech and BABA found their bottoms in early 2016. The Fed raised 8 more times over the next 2 years. Biotech was up 140% and Alibaba was up 258% in this 2-year period of tightening (8 hikes).
Moral of the Story: The fear of tightening can be WORSE than the actual tightening itself. We’ve been early on these two but adding into weakness regularly as we see a longer-term major inflection starting. They are simply too cheap at these levels.
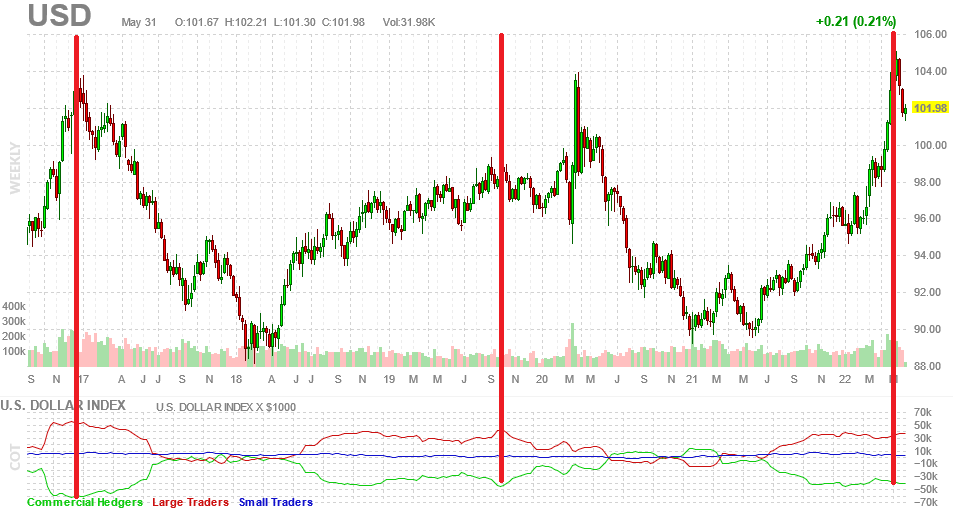
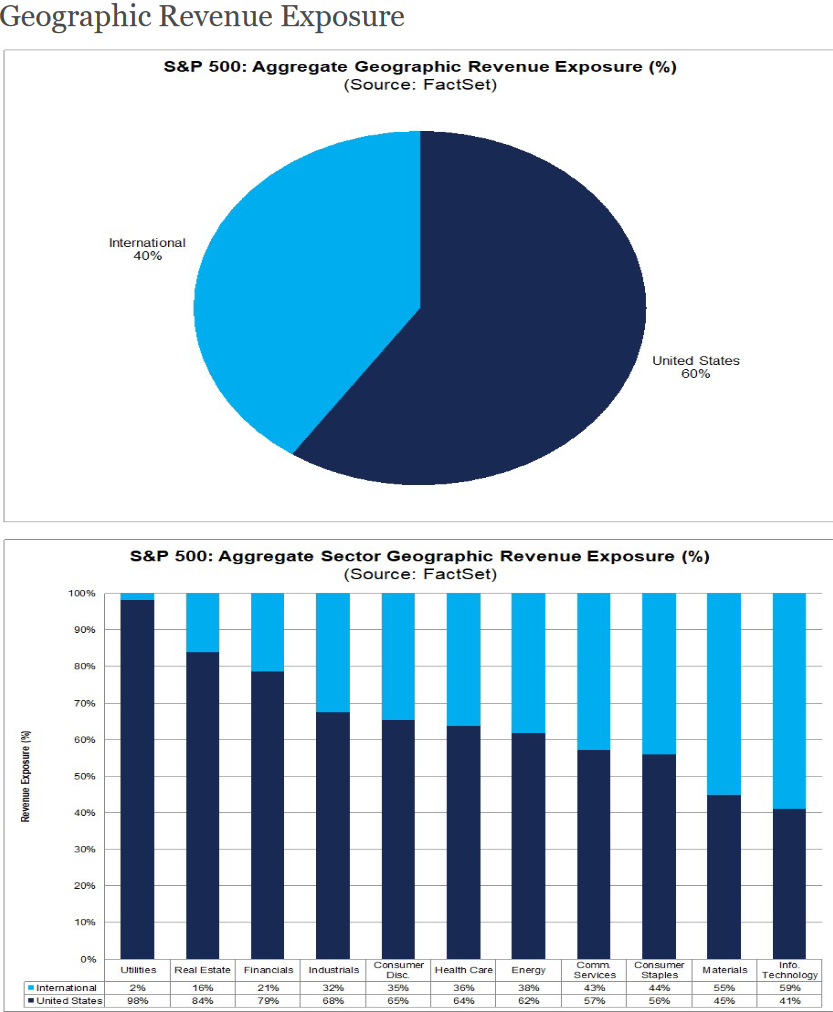
Last week we pointed out the moderation of the USD that we have been expecting. Based on how “Commercials” are positioned, we expect this to persist into 2H. This would be a major tailwind for earnings that no one is counting on. The tech sector will be the biggest beneficiary:
(Click on image to enlarge)
Now onto the shorter term view for the General Market:
In this week’s AAII Sentiment Survey result, Bullish Percent (Video Explanation) jumped to 32% this week from 19.8% last week. Bearish Percent dropped to 37.1% from 53.5%. “Opinion follows trend…”
The CNN “Fear and Greed” ticked up from 14 last week to 26 this week. Sentiment is thawing in the market. You can learn how this indicator is calculated and how it works here: (Video Explanation)
And finally, the NAAIM (National Association of Active Investment Managers Index) (Video Explanation) rose to 33.19% this week from 19.51% equity exposure last week.
(Click on image to enlarge)
Our podcast|videocast will be out on Thursday or Friday this week. Each week, we have a segment called “Ask Me Anything (AMA)” where we answer questions sent in by our audience. If you have a question for this week’s episode, please send it in at the contact form here.
Disclaimer: Not investment advice. For educational purposes only: Learn more at HedgeFundTips.com.


