
While the S&P 500/SPX and other major stock averages continue to hit new all-time highs day after day seemingly, gold remains relatively subdued. In fact, while the SPX is up by 38% over the last year, gold is down by more than 5%.
Gold vs. The S&P 500
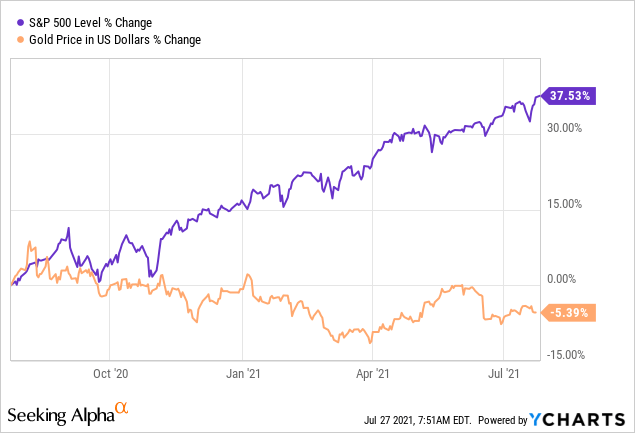
Data by YCharts
So, what's wrong with gold? You would think that at a time of higher growth and inflation, falling interest rates, the easiest monetary policy in history, monstrous debt, and an ever-expanding monetary base, gold would be going through the roof, but it's not.
Here's what I think is happening:
The Inflation Interest Rate Dynamic
CPI Inflation
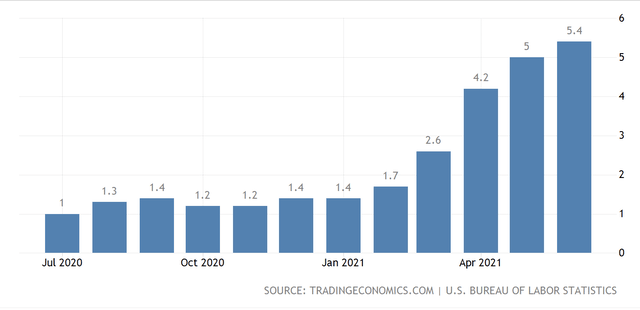
Source: tradingeconomics.com
CPI (consumer inflation) is surging to some of its highest levels in the last 25 years. 5.4% is relatively high, and we have not seen such elevated inflation on a sustainable basis since the late 1980s/early 1990s. There were some comparable readings in the lead-up to the financial crisis of 2008, but high inflation may turn out more persistent than many market participants anticipate this time.
PPI Inflation
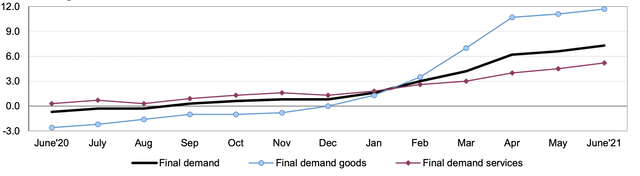
Source: bls.gov
If you think that consumer inflation looks hot, look at producer prices. Here we see about a 12% YoY increase in final demand goods prices. This reading illustrates the surging costs producers are paying for raw materials now, costs that companies will very likely pass down to consumers in coming months and quarters. Therefore, we can expect to see even higher consumer inflation going forward.
Core PCE Inflation
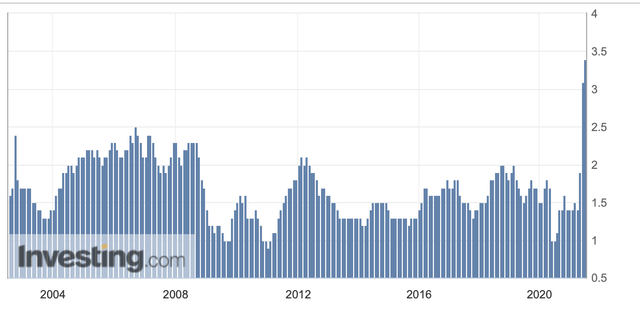
Source: investing.com
The core PCE, which is the Fed's inflation gauge of choice, has not been this elevated in nearly 30 years. Not even the pre-financial crisis days of 2008 came anywhere close to the readings we see right now. The CPE illustrates that while food and energy-related costs may have risen more rapidly in recent decades, an average basket of everyday purchases hasn't shot up in price this fast in nearly 30 years. The bottom line is that inflation is rising sharply, and there doesn't appear to be anything transitory about the move.
10-Year Treasury
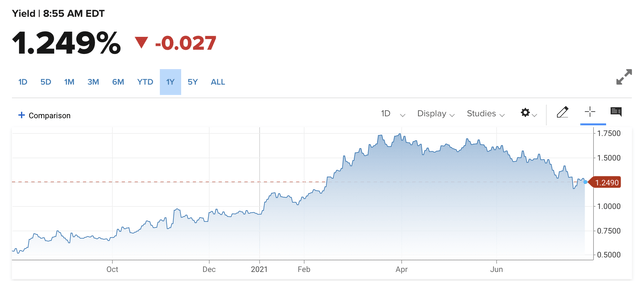
Source: cnbc.com
Remarkably, while inflation is spiking around us, the 10-year and other key treasuries are heading south. Whereas the 10-year hit a high of around 1.75% earlier this year, the key rate has retreated to below 1.25% now.
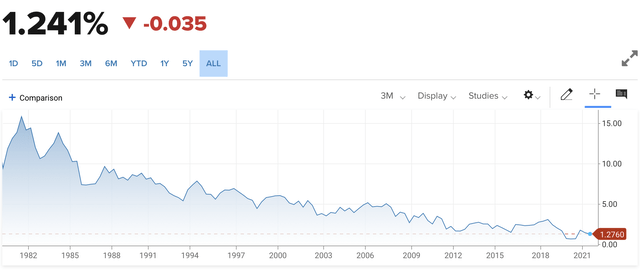
10-year long-term chart
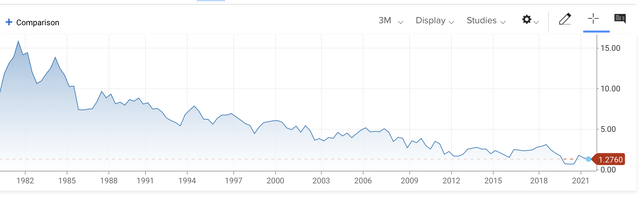
Source: cnbc.com
Moreover, we see that while the 10-year was substantially higher during prior times of elevated inflation, it is much lower this time, and the long-term trend is still lower. This steady downtrend illustrates that while investors could get substantial yields in the Treasury markets during times of elevated inflation in the past, that is not the case this time. If adjusted for inflation now, the 10-year yields around a negative 4% in "real interest." This dynamic of negative real interest yielding treasuries should continue going forward. This phenomenon is bullish for gold as the yellow metal essentially competes with Treasuries for market share in the safe-haven asset market. While demand for gold is lackluster right now, it will likely increase as demand drops off for negative yielding real rate investments like Treasuries and other bonds.
The Fed's Not Raising Rates Any Time Soon
You don't need to worry about rates going up any time soon because the Fed is not raising them.
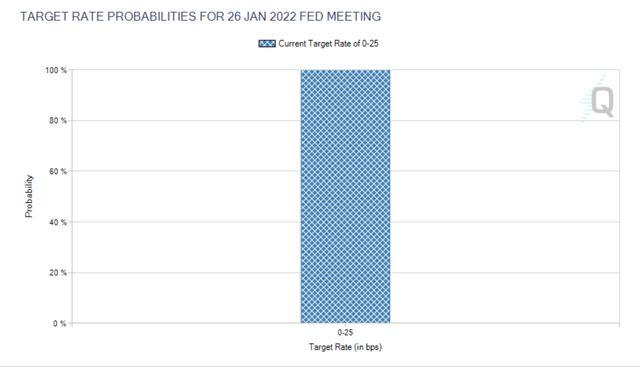
Source: federalreserve.gov
There is a zero percent probability that the Fed will move the Fed funds rate up this year.
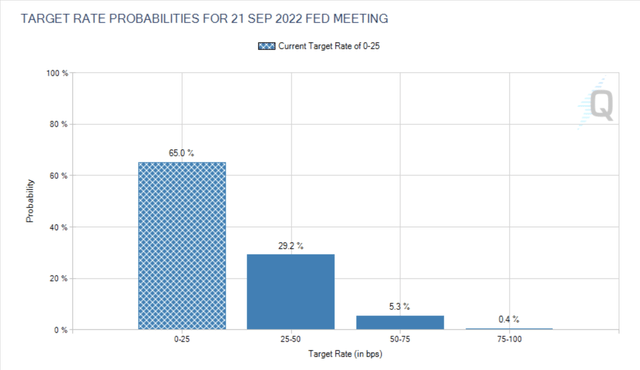
Source: federalreserve.gov
The Fed is not expected to start moving rates higher until Q4 2022. Even then, there is a very high probability that there may only be one or possibly two rate hikes by year-end 2022. The bottom line is that there may be no rate hikes in 2022, but if there are, the benchmark rate should remain below 1-2% for some time.
Let's Look at the 10-Year
Source: cnbc.com
There is a reason why the 10-year long-term trend is lower and lower. Also, it is not just the 10-year, but all major Treasuries. Besides the continuous need for ultra-low rates to keep economic activity expanding, there is the enormous national debt burden to consider.
The Debt
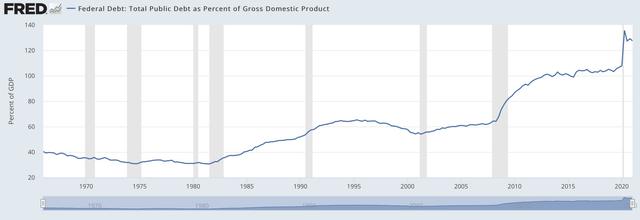
Source: fred.stlouisfed.org
Towering at over $28.57 trillion, the national debt burden is stupendous. The U.S.'s national debt to GDP ratio is now above 128%, and America's total debt is approaching 144% of GDP. This level of debt is remarkably high. Given that much of the national debt is comprised of U.S. Treasuries, Treasury yields must remain subdued for debt servicing payments to stay manageable.
Debt Servicing Payments
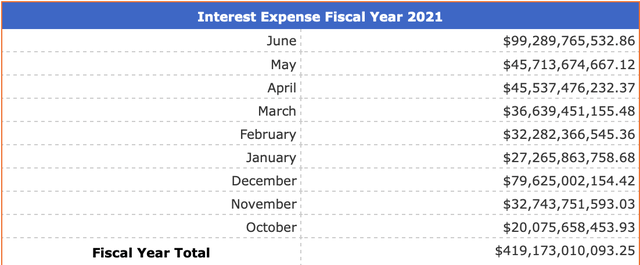
Source: treasurydirect.gov
The U.S. (taxpayers) dished out nearly $420 billion in debt servicing payments alone over the last fiscal year. Now, this is at an average rate of just around 1.5%. Imagine what would happen if the 10-year was closer to 3%, and debt servicing was around that same rate for a year. Yes, we would be looking at annual debt servicing payments of $700-800 billion (in one word, "unsustainable"). The immense debt burden is one of the primary reasons why the Fed may never raise rates notably again (think of Japan). While rates are low and ultra-easy monetary policy is the norm, the money supply should continue to expand perpetually.
The Monetary Base Gold Price Correlation
The Fed's Balance Sheet
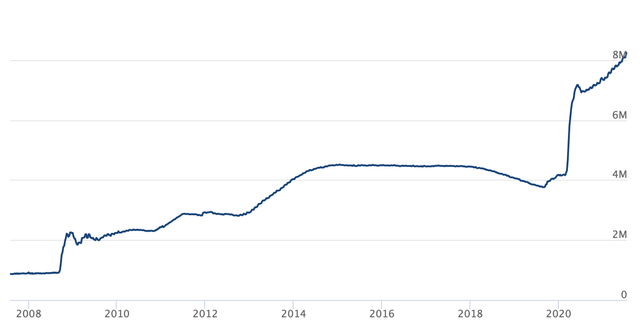
Source: federalreserve.gov
The Fed's balance sheet has grown immensely since 2008. While the Fed attempted to unload some of its assets in 2018, it quickly became clear that the economy could not withstand excess demand. The Fed's balance sheet is now at over $8 trillion and climbing. The Fed's QE program enables the U.S.'s monetary base to expand continuously.
Monetary Base
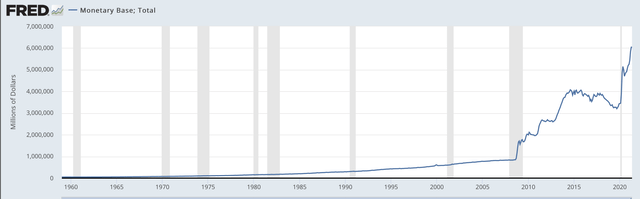
Source: fred.stlouisfed.org
If we look back on the monetary base, the base was only about $50 billion when the buck was still pegged to gold in 1960. Back then, throughout the late 30s, 40s, 50s, and 60s, the price of gold was steady at around $35. Gold only began to appreciate in the 1970s as the dollar decoupled from the gold standard then.
However, gold's long-term appreciation trajectory continued to mirror monetary base expansion exceptionally closely throughout the years. Suppose we look at 1960 to the late 1990s, the monetary base expanded by about 1,000% (from roughly $50 billion to around $550 billion) in this time frame. Likewise, gold showed a very similar appreciation, about 1,000% from $35 in 1960 to around $385 by the late 1990s. If we look at the pre-financial crisis era, the monetary base appreciated close to a trillion dollars, roughly a 1,900% gain from the 1960's level. Gold also gained about 1,900% in the same time frame, moving from $35 to around $700.
However, with all the monetary inflation of late, we start to see a significant lag in the price of gold. As of right now, we're looking at about a 12,000% increase in the monetary base since 1960. Yet, gold is up by only about 5,000% in the same time frame. This lag factor could be because market participants believe that excess liquidity will get extracted from the market at some point, or maybe it's just different this time. However, it seems likelier that the market is simply behind the curve right now, and the price of gold will probably catch up. A 12,000% gain from the $35 level would put the price of gold at around $4,235, roughly a 135% gain from its current price. Also, this monetary expansion cycle is not over yet. Therefore, gold could potentially go to $5,000 or higher over the next several years, which opens the door to many possible buying opportunities.
The Bottom Line
We are in a remarkably favorable environment for gold right now. Inflation is at its highest level in decades, interest rates are at meager levels, Fed policy is ultra-accommodative, the national debt is sky-high, and the monetary base is exploding higher. Gold should be surging, yet it is stuck around $1,800, well off its highs of approximately $2,090. There is an evident lag in gold price appreciation relative to monetary base expansion right now. However, this dynamic may not persist for much longer, as major treasuries deliver negative real yields, and the monetary base continues to balloon exponentially. Therefore, the price of gold could appreciate considerably to maintain its historical correlation with monetary base expansion. Gold would have to rise to $5,000 to catch up to the monetary base's increase, roughly a 178% gain from current levels.
Gold Stocks to Own in this Environment
If we are banking on gold going higher, we want to be invested in gold mining companies and ETFs.
Some of my favorite stocks include:
Kirkland Lake Gold (KL)
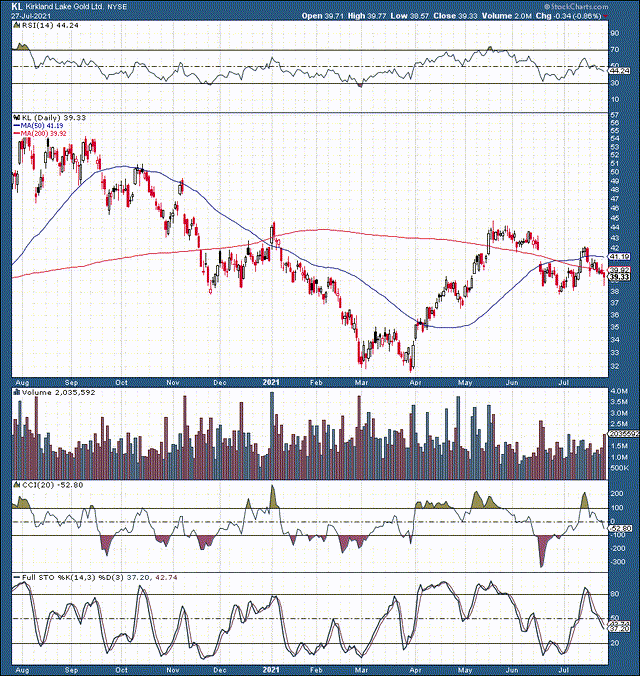
Source: stockcharts.com
Kirkland Lake trades at about a 12x P/E multiple. While the company's growth projections are modest, KL should experience higher than anticipated growth if the price of gold appreciates. There is a uniform trend in gold miners' estimates. Most analysts seem to have a skeptical view of future gold prices, as stagnant or declining figures seem factored in for coming years. In addition, KL pays a dividend of approximately 2%. On the downside, there is a strong support level at $38, with an initial stop-out level slightly below. To the upside, we want to see a move above $42 resistance to realize further upside in this name.
Newmont Corporation (NEM)
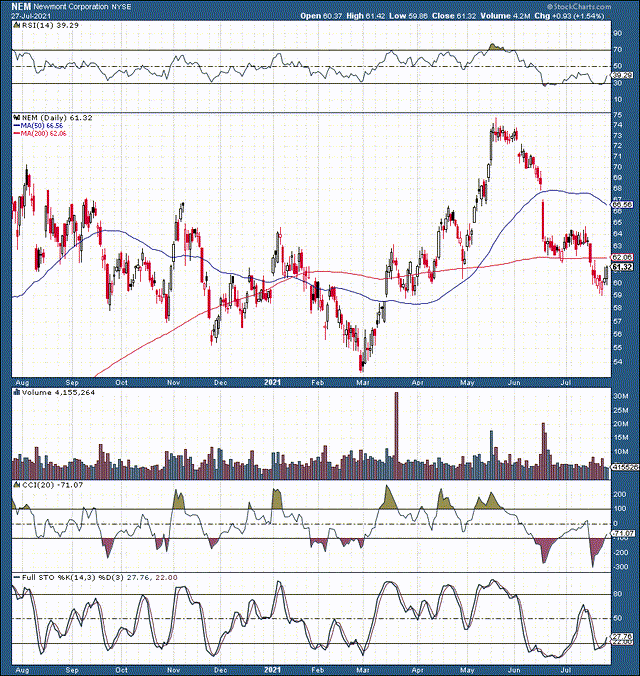
Source: stockcharts.com
Newmont is the biggest gold mining company in the world. Newmont is efficient, and it is highly profitable. The company trades at about a 17x P/E multiple, and its growth projections appear suppressed due to analysts' expectations for stagnant or lower gold prices in coming years. NEM pays a dividend of about 3.7% and is in a prime position to capitalize in an expanding gold market. From a technical standpoint, we see that the stock likely just bottomed at the $59-60 support level. The initial stop-out is slightly below $59, with the initial breakout point coming up at the $64-65 resistance level.
Gold Fields (GFI)
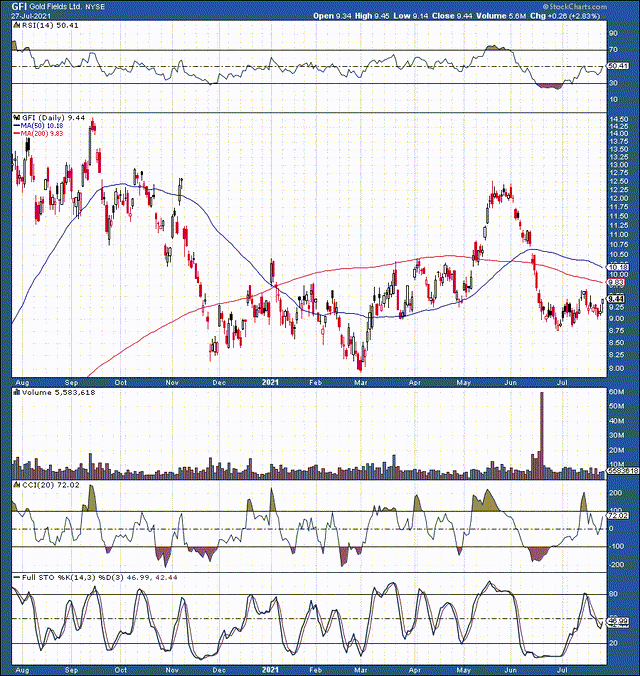
Source: stockcharts.com
Gold Fields is another solid gold name with a lot of value in the mining space. This stock trades at a P/E multiple of only about 9.6 and appears to suffer from overly pessimistic analysts' growth estimates. GFI pays a dividend of about 3.4%, and the stock looks like it recently bottomed. Critical support is at $9-8.75, with an initial stop-out point slightly below lower-end support. I am looking for a gap up to the $10.75 level and a continuation above the crucial resistance level at $11.
Kinross Gold (KGC)
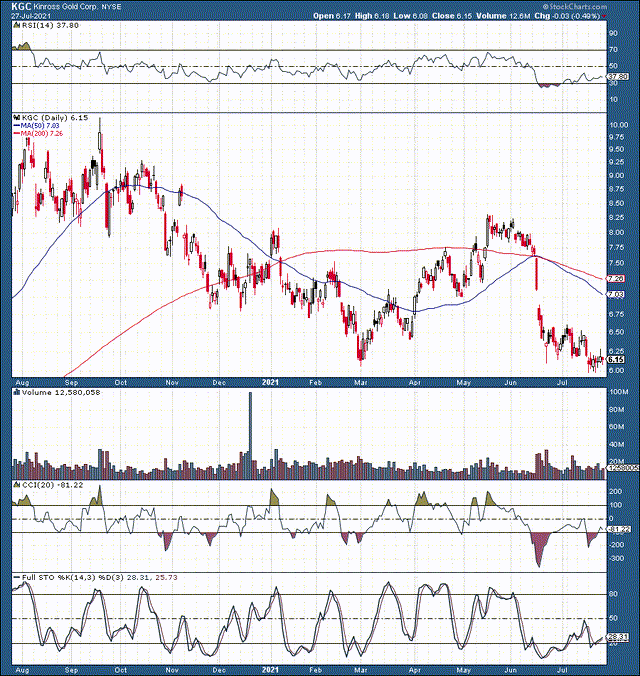
Source: stockcharts.com
Kinross is amongst the cheapest of the well-known miners. KGC trades at just 7.2 times 2022's EPS estimates (consensus). While analysts predict 20% revenue growth next year, like other miners, growth estimates drop off from there. Again, this is likely due to the low-end forecast for gold prices in the future. KGC pays a dividend of 2%, and the technical image may improve going forward. KGC is coming off extremely oversold levels, and $6 is a critical support level now. Slightly below $6 can be utilized as a just-in-case stop-out point. On the upside, we want to see a move up to the gap fill area around $7 and then higher.
Comments
Log in or sign up to join the conversation.