
Bullish Sentiment Remains In Place For Gold
(Click on image to enlarge)
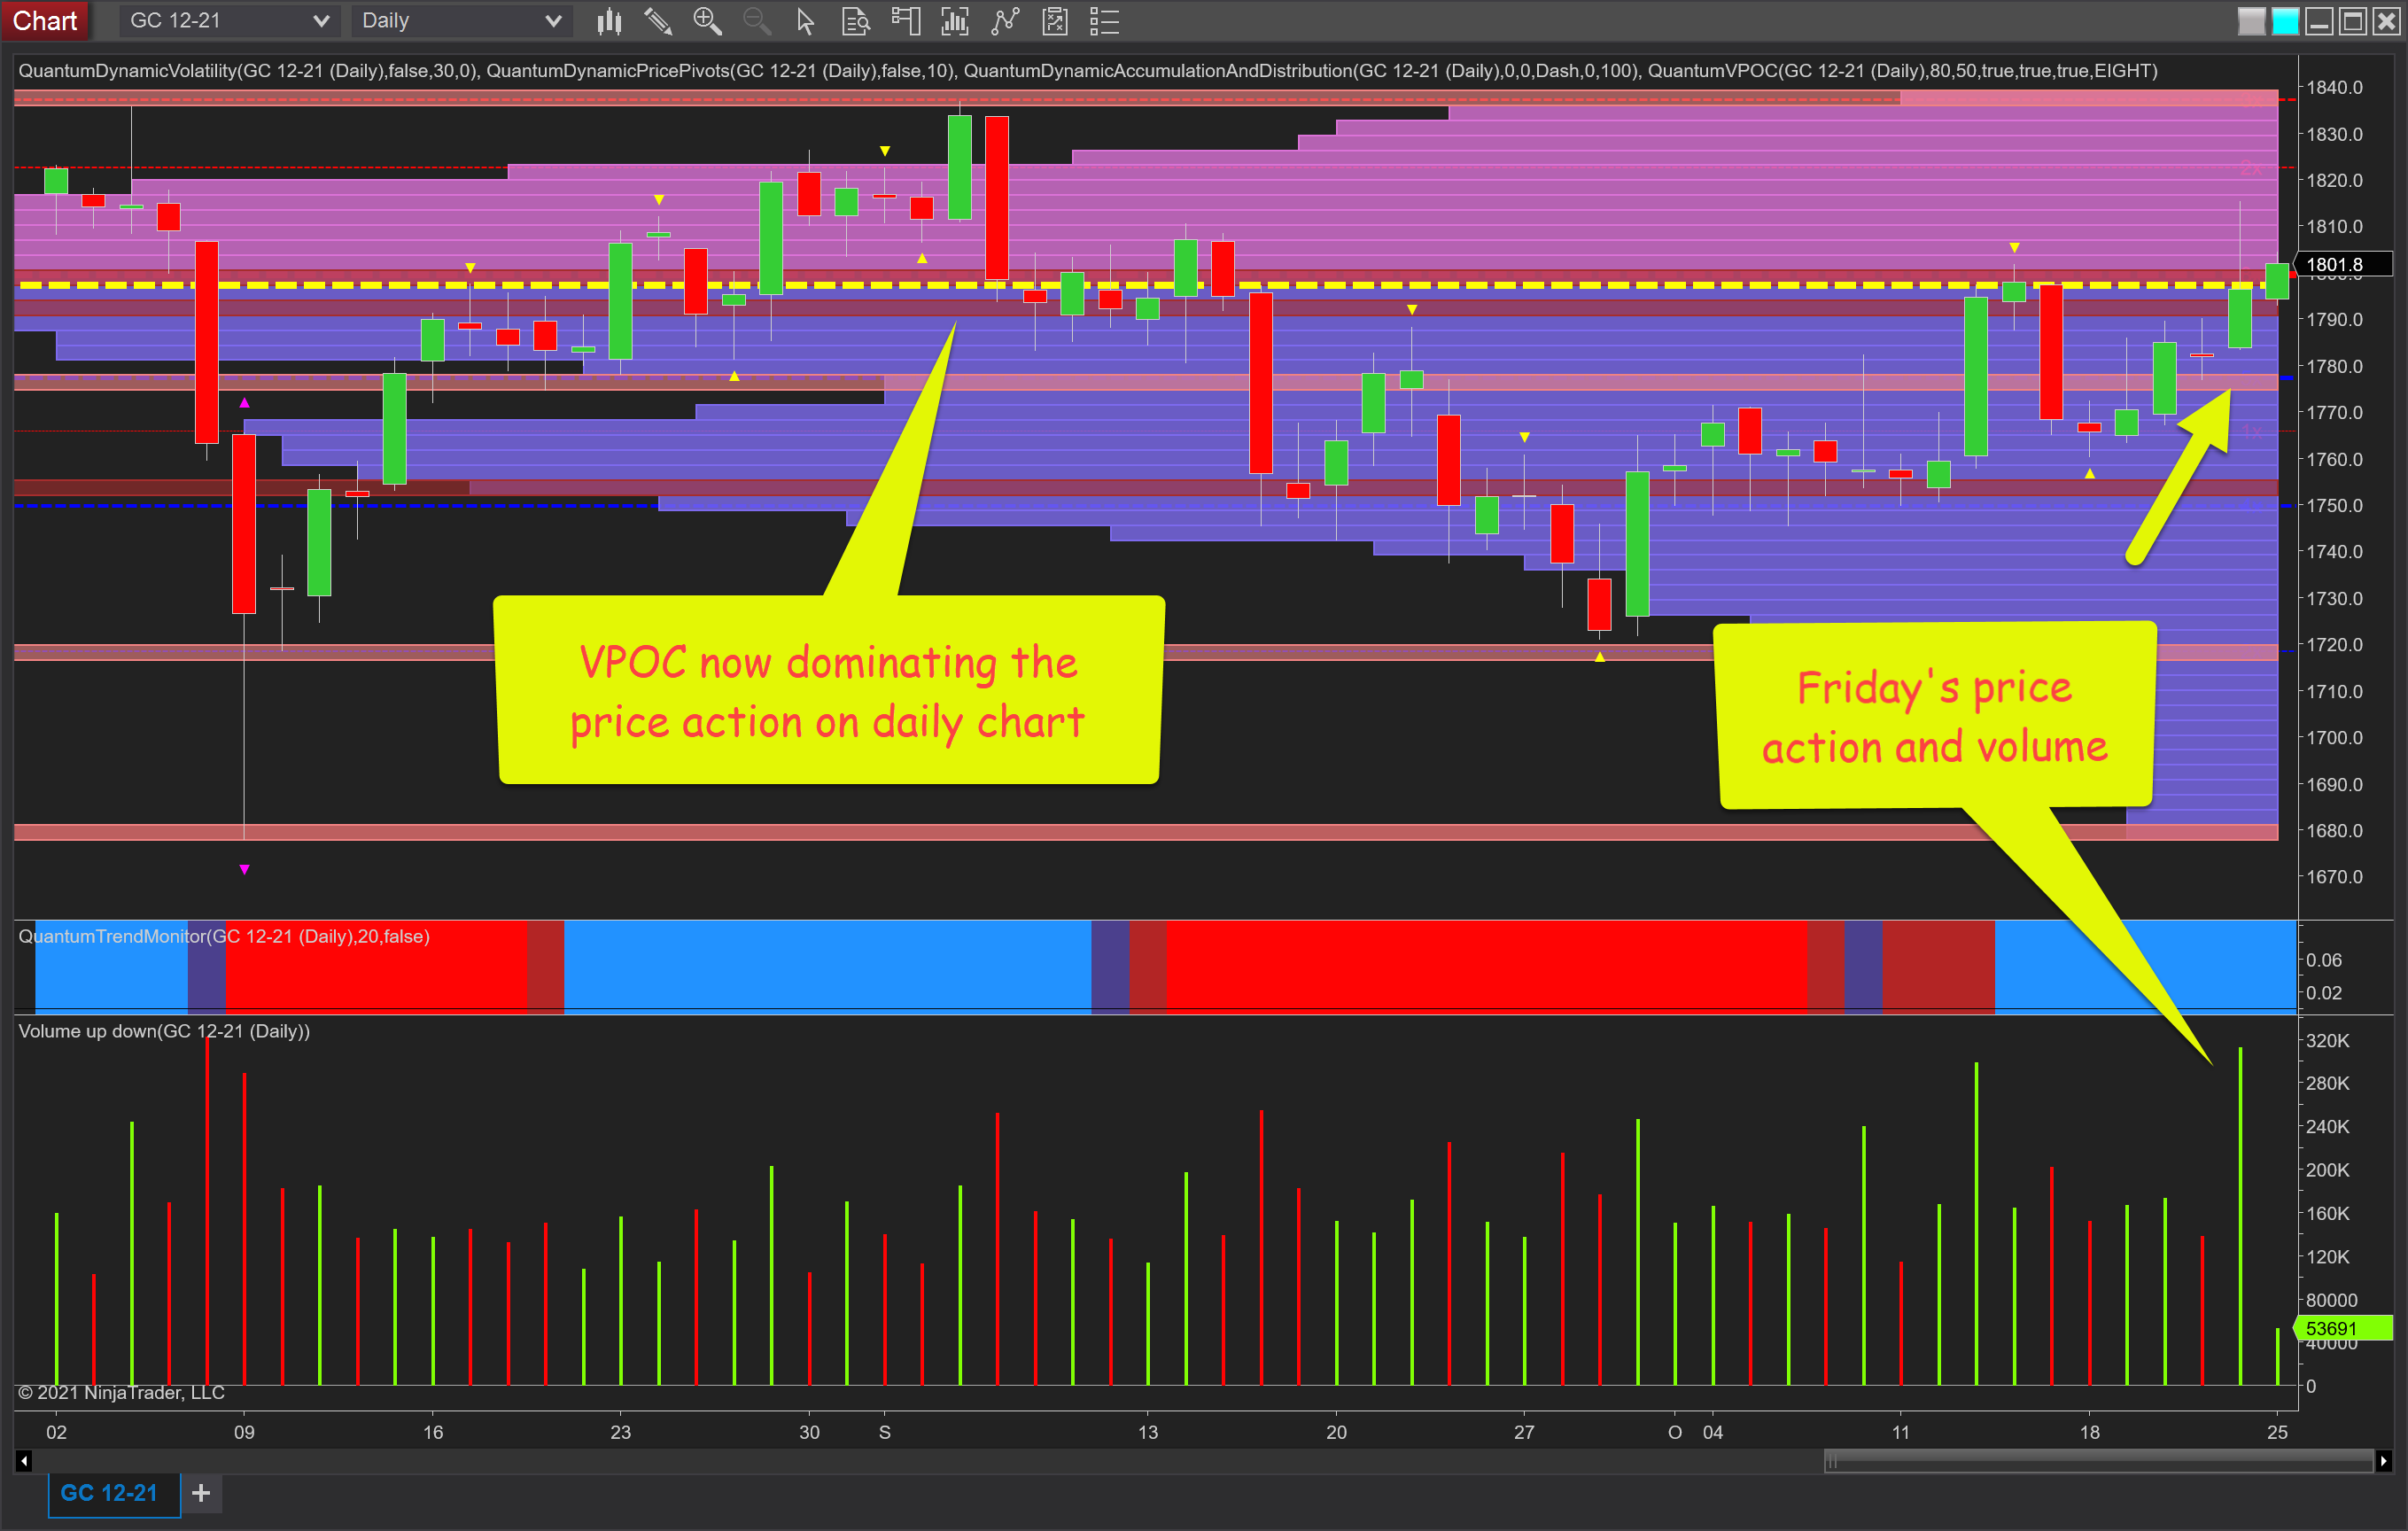
It was another rollercoaster ride for gold last week, but despite the volatile price action, was one that continued to maintain the bullish momentum for the precious metal, and as always it pays to consider multiple timeframes of which the daily and weekly are both significant. If we start with the daily chart, it is the volume point of control at the $1800 per ounce price level which is once again the key technical aspect of the chart and setting the tone for the short term with further congestion at this level, therefore, to be expected. The price action of Friday was probably the most interesting of last week with extreme volume propelling gold through this region only for it to close just below at $1796 per ounce as the sellers took their profits ahead of the weekend. Nevertheless a positive signal of big operators intent to continue to drive gold higher, with the market trading higher at the start of the new week and currently at $1800.70 per ounce at the time of writing.
(Click on image to enlarge)
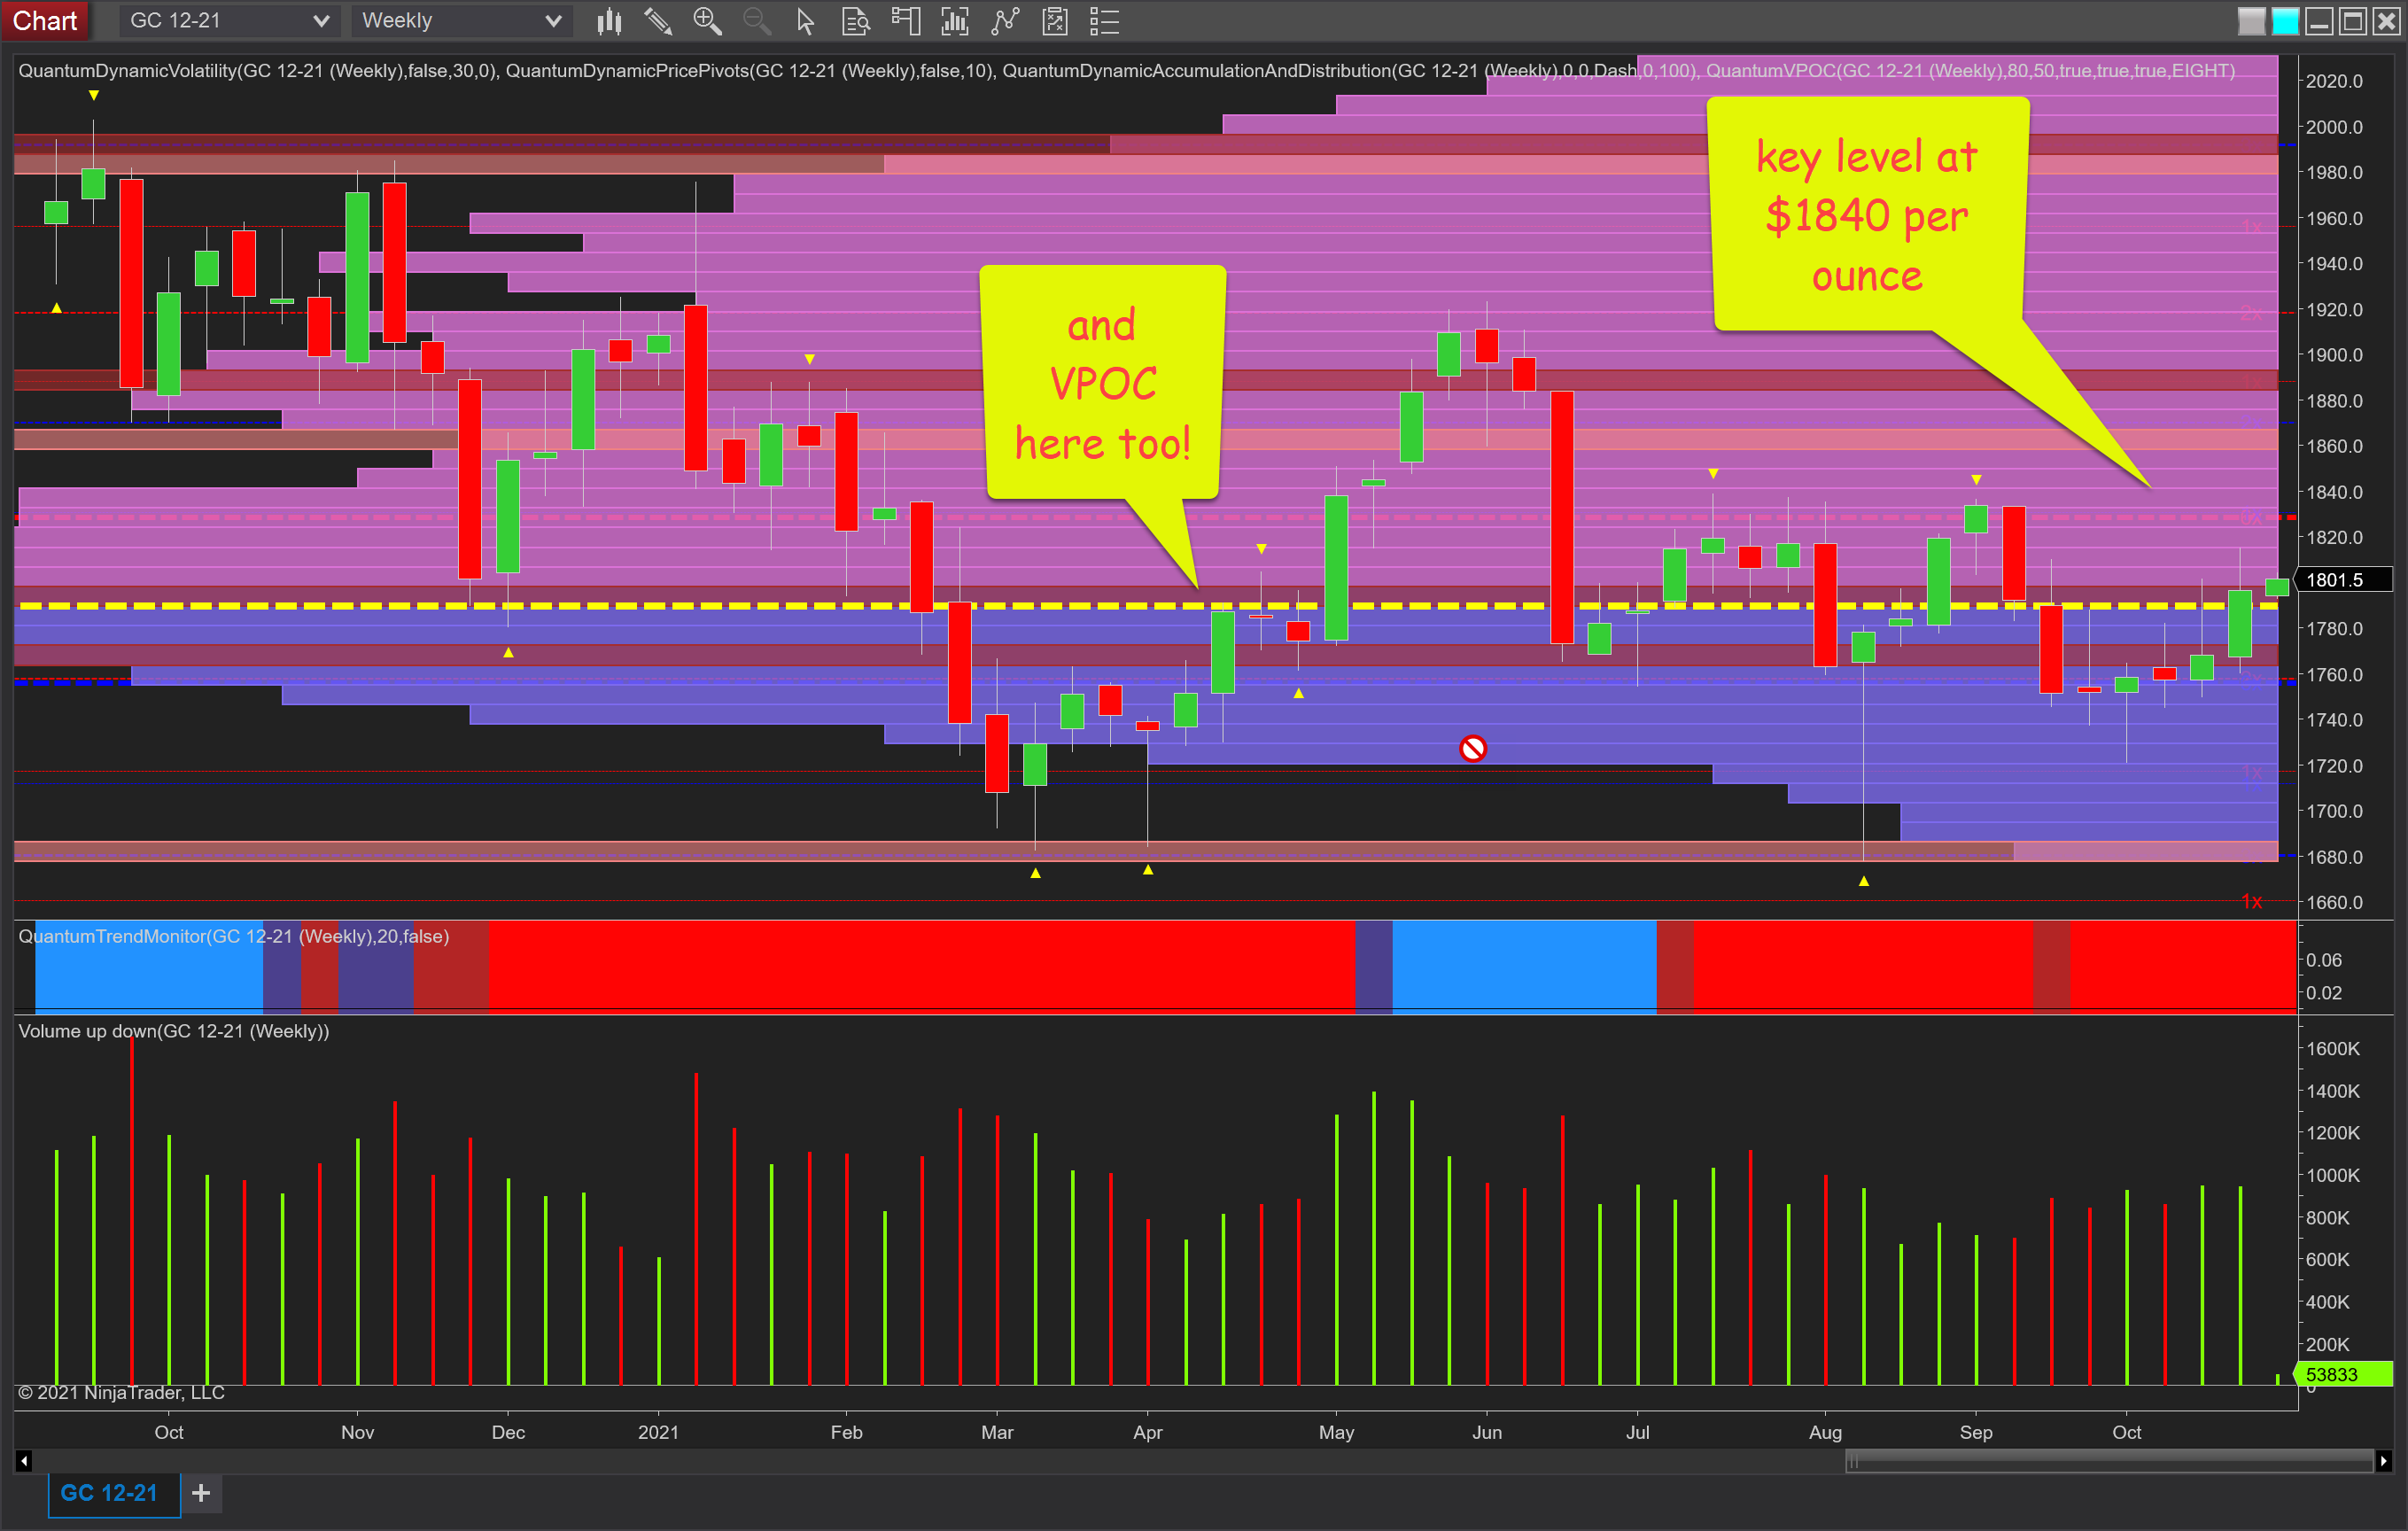
Moving to the weekly chart and one I have referenced several times before, here it is the $1840 per ounce level which is a key level of resistance and one which will define the longer-term outlook, and once breached will provide the requisite platform of support to a longer-term bullish trend. And with inflation building relentlessly this is likely to provide the catalyst for a strong move into next year.
Disclaimer: Futures, stocks, and spot currency trading have large potential rewards, but also large potential risk. You must be aware of the risks and be willing to accept them in order to invest in ...
more

