
Another “Strongest Since” Inflation Indicator
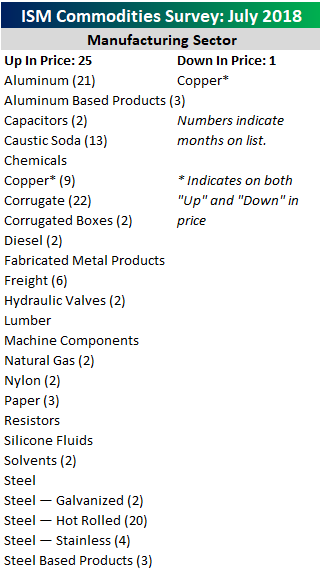
When it comes to different inflation readings, many releases have been accompanied by the phrase “strongest since” or something similar sounding. In each month’s ISM Manufacturing report, respondents are asked which commodities they have seen price increases for and which ones they have seen declines in. In this month’s report, respondents noted price increases in 25 different commodities and declines in just one (Copper- which was actually on both lists).
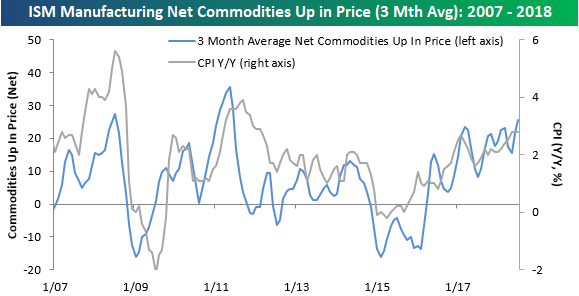
Going over each month’s ISM report, we have compiled an index which tracks the three month average of the net number of commodities that are up in price each month. With this month’s report, the three-month average of the net number of commodities rising in price rose from 21.7 up to 25.7. That’s a pretty big jump for a single month, and it also represents the highest reading for the index since June 2011. The chart below compares our ISM Commodity Survey index to y/y CPI going back to 2007. Over time, there has been a pretty positive correlation between the two, and in some cases, big moves in the ISM Commodities Survey even preceded a move in CPI. With that in mind, this month’s reading in the Commodities Survey index confirms the current leg higher in CPI and may even suggest further upside going forward.


Asset inflation can be a tax if there is little wage inflation.