An Ominous Pattern On The Daily Gold Chart
(Click on image to enlarge)
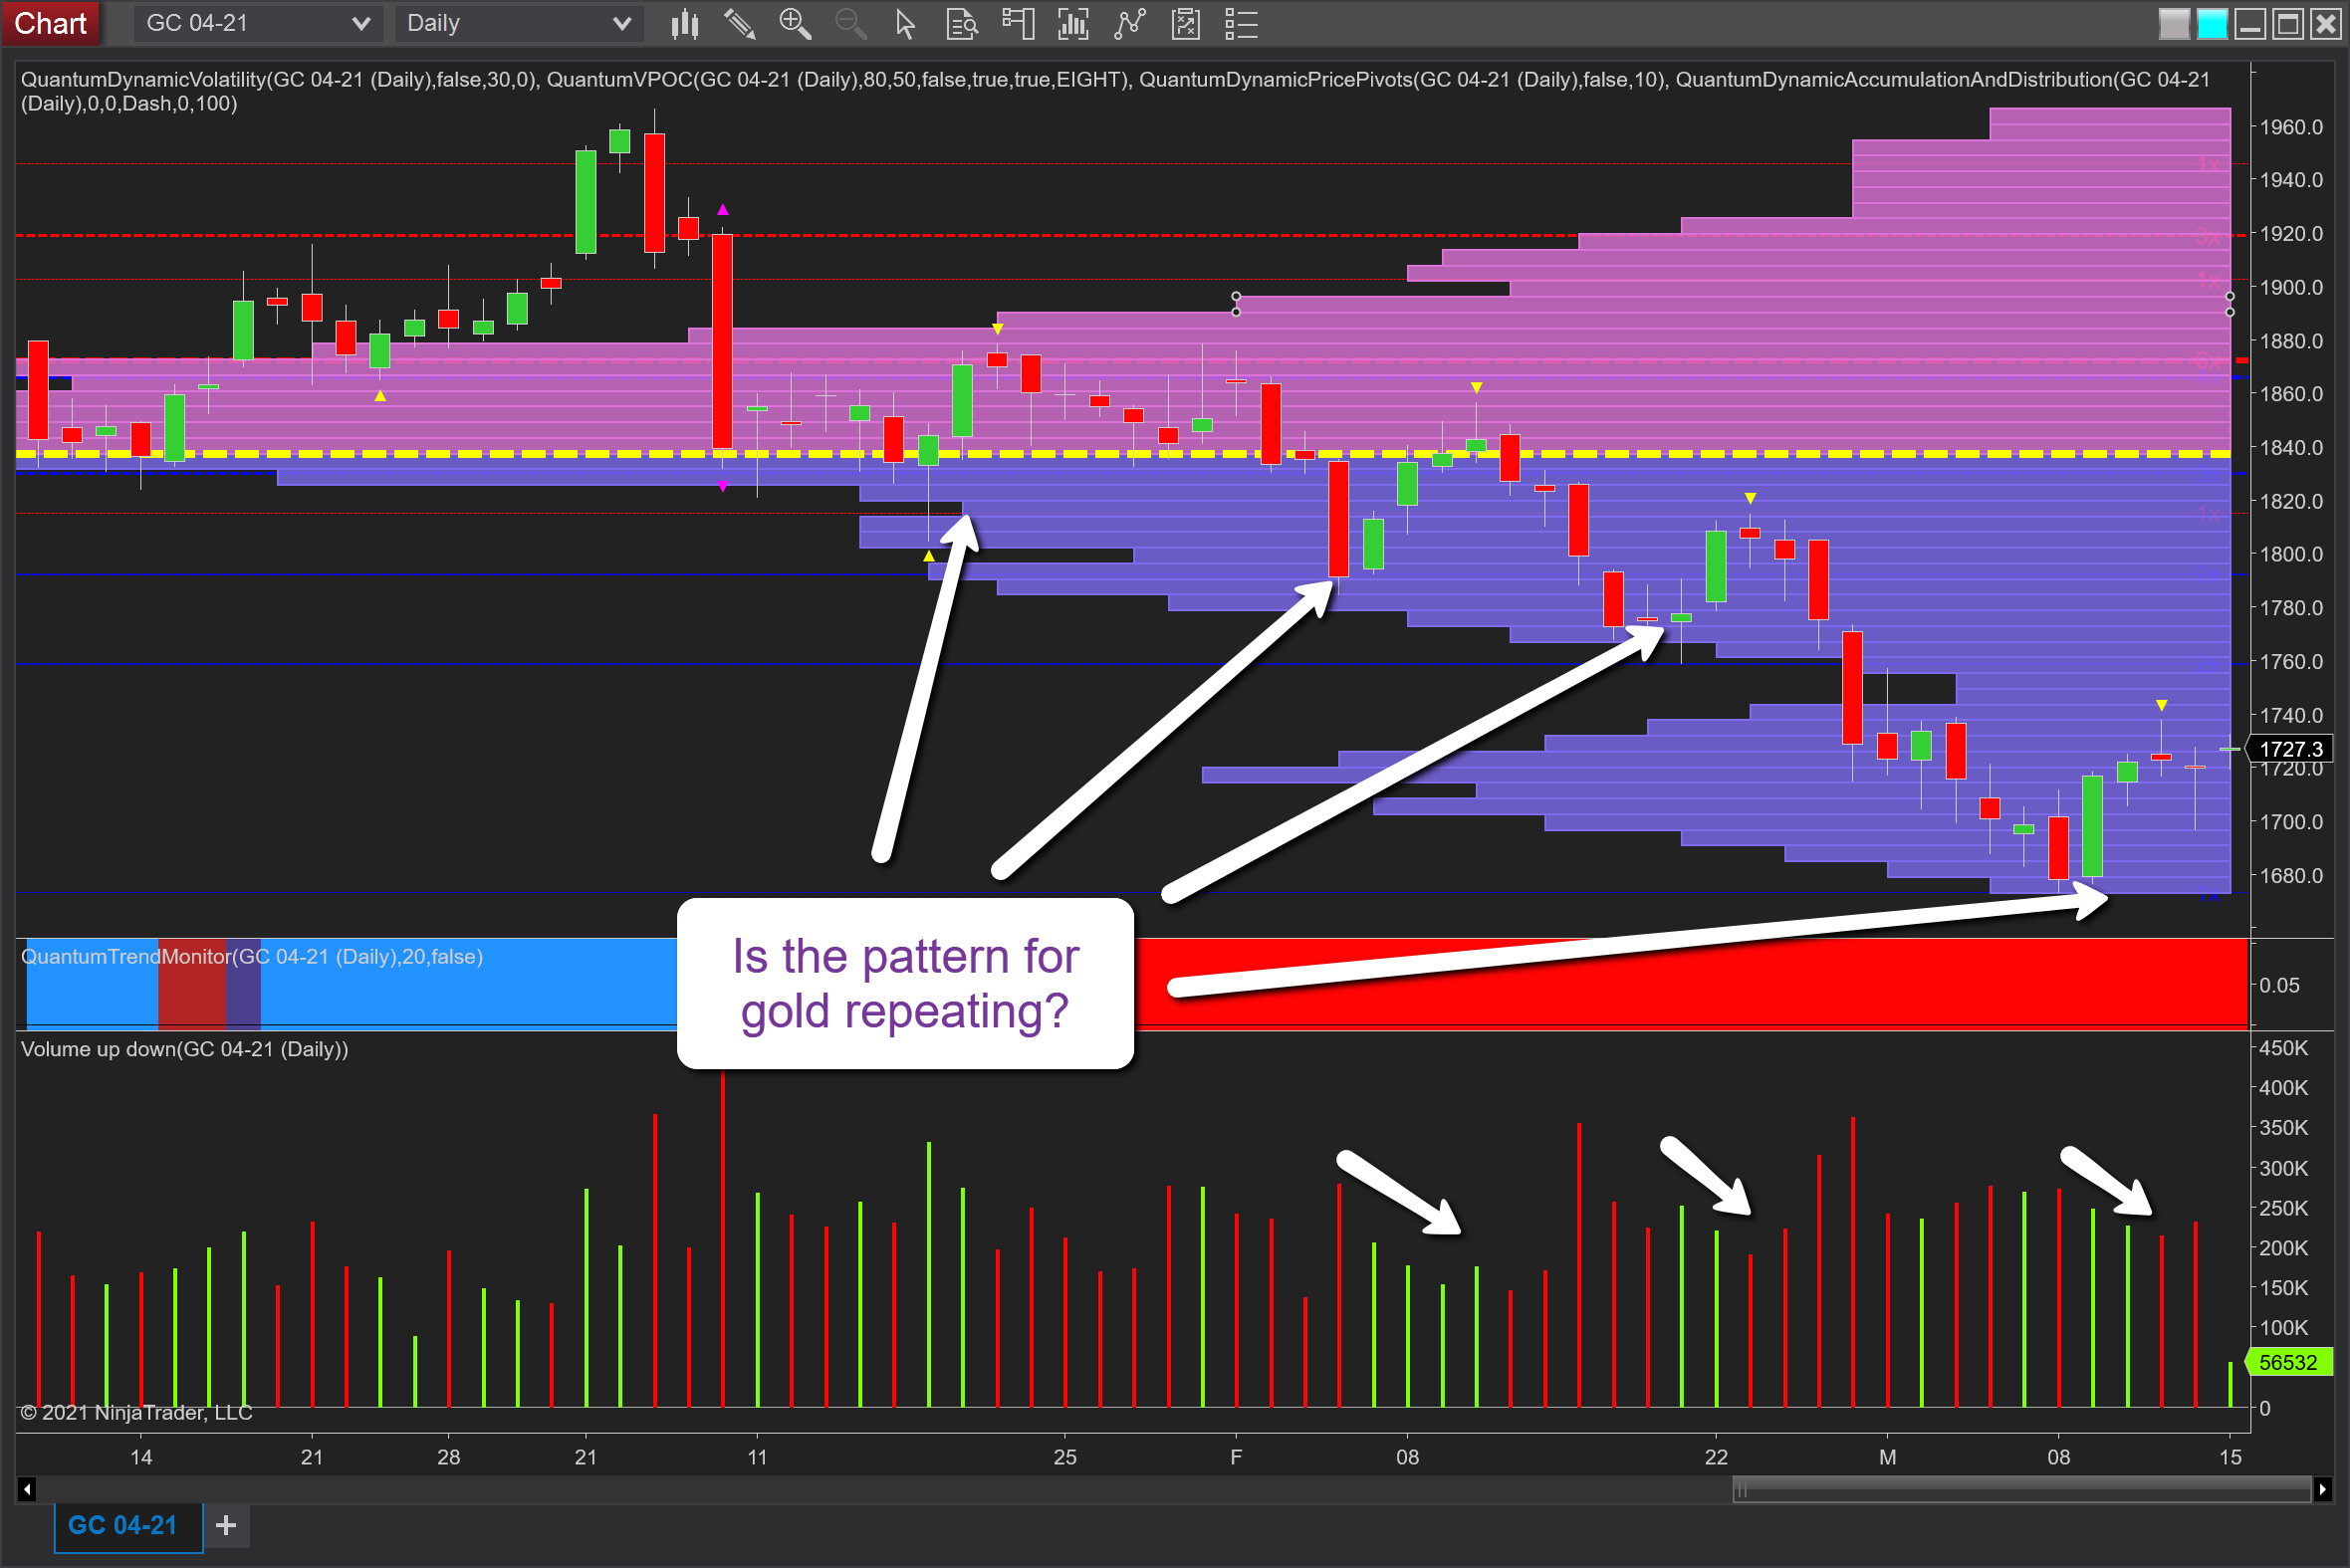
A familiar pattern for gold and one I have highlighted before in earlier posts, and last week’s price action describes this perfectly once more. The question this time is whether this rally will indeed be the precursor to something more sustained, or will it fizzle out and simply be yet another failure to stem the longer-term bearish trend?
If we take a look back over the last three months, this pattern is clear. We saw a minor recovery in January lifting from the volume point of control (VPOC) at $1840 which was snuffed out with a subsequent return to the fulcrum of the market. Then in February, we witnessed a more pronounced effort. But note how this was accompanied by falling volume, so not going far. At the end of the month, there was another, this time on two candles, but once more the volume declined. And finally, we have last week’s effort to rise, but note once again the weakness on falling volume and followed by Thursday’s candle which closed well off the highs on good volume.
Friday saw some buying, but probably not enough to influence the longer-term trend. So more downside is likely and for any return to a bullish trend, we will need to see some serious buying volumes over an extended period assisted by gold’s role as an inflation hedge.
Disclaimer: Futures, stocks, and spot currency trading have large potential rewards, but also large potential risk. You must be aware of the risks and be willing to accept them in order to invest in ...
more


