

Amazon CEO Andy Jassy has been touting the benefits his company receives from AI. In particular, he recently discussed Amazon Q, their “GenAI assistant for software development.” GenAI updates its foundational software. Per Jassey, this task is essential but dreaded by its employees. GenAI takes some of the onus off developers, allowing them to use their skills better for more financially rewarding projects for Amazon. The benefits Amazon receives from GenAI are tremendous. Per Andy Jassy:
– The average time to upgrade an application to Java 17 plummeted from what’s typically 50 developer-days to just a few hours. We estimate this has saved us the equivalent of 4,500 developer-years of work (yes, that number is crazy but, real).
– In under six months, we’ve been able to upgrade more than 50% of our production Java systems to modernized Java versions at a fraction of the usual time and effort. And, our developers shipped 79% of the auto-generated code reviews without any additional changes.
While Amazon’s benefits seem substantial, not everyone agrees AI is all it’s cracked up to be. For example, a study by the Upwork Research Institute, based on interviews with 2500 C-suite executives, finds a disconnect between increased productivity expectations of AI and actual employee experiences.
Despite 96% of C-suite executives expecting AI to boost productivity, the study reveals that, 77% of employees using AI say it has added to their workload and created challenges in achieving the expected productivity gains. Not only is AI increasing the workloads of full-time employees, it’s hampering productivity and contributing to employee burnout.
The jury is out on AI’s actual productivity benefits. However, the potential productivity gains will certainly keep corporate spending on AI immense for the time being. With that, we look forward to Nvidia’s earnings tomorrow.
(Click on image to enlarge)
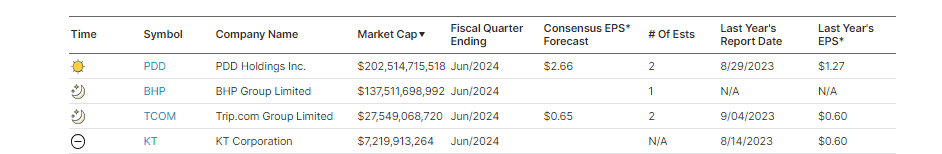
What To Watch Today
Earnings
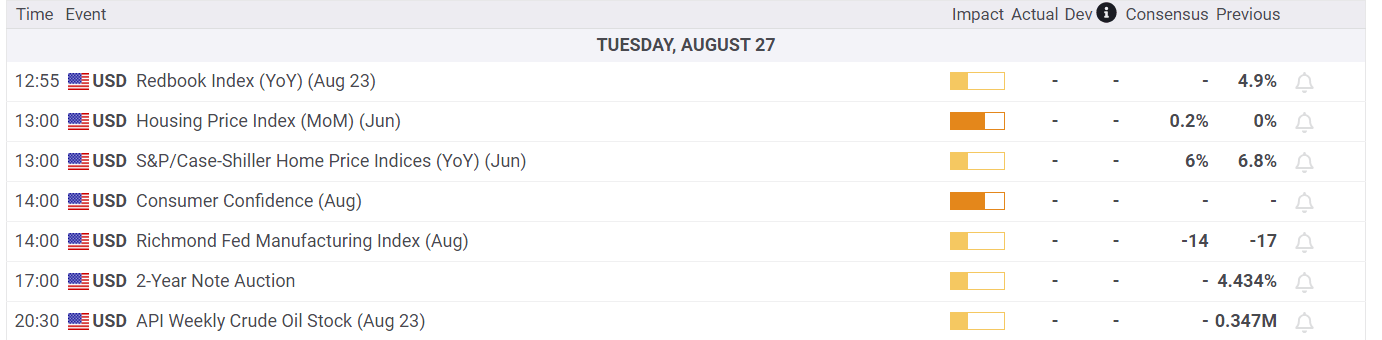
Economy
Market Trading Update
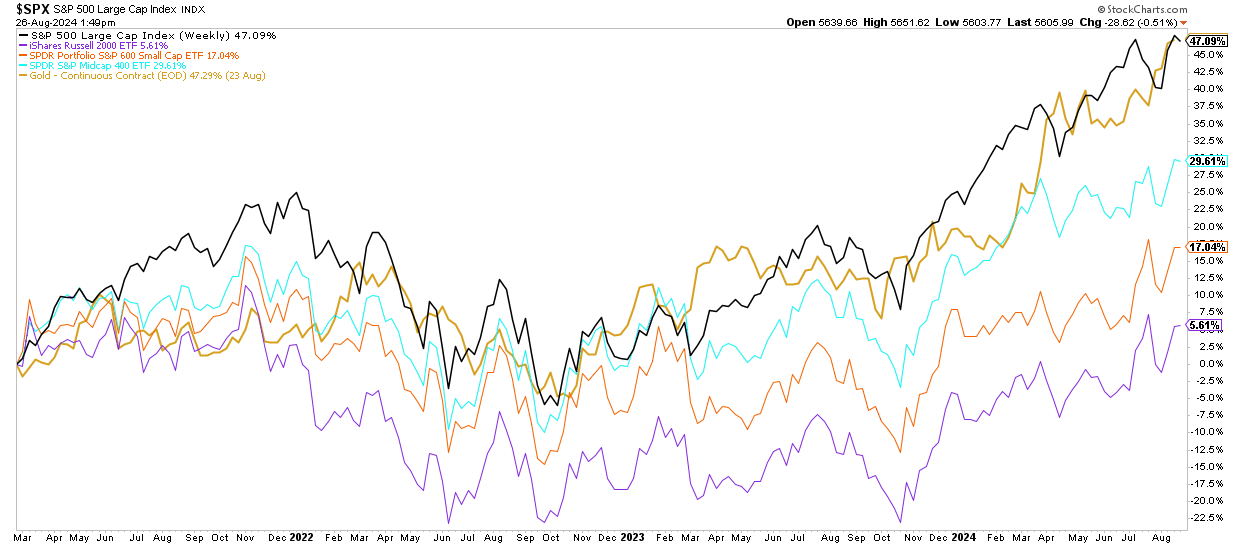
As we discussed yesterday, the market’s bullish backdrop remains, suggesting that the volatile sell-off of a few weeks ago is over, at least for now. However, two charts jumped out as I researched for the newsletter this weekend.
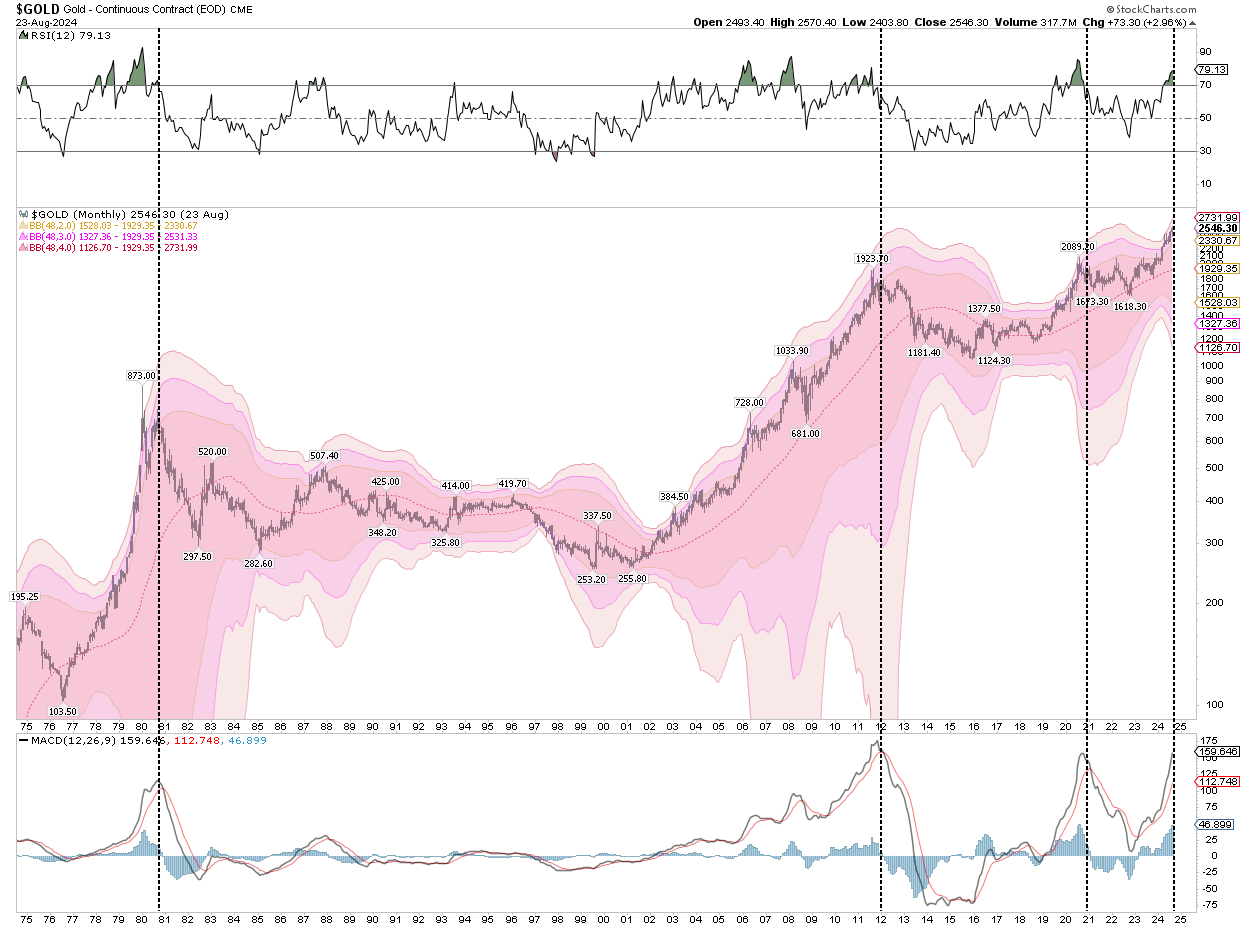
The first is the monthly chart of Gold prices. Precious metals have risen over the last two years as speculative fervor increases in the marketplace. As is always the case, too much money chasing too few assets is both a blessing and a curse. The “blessing” is rising asset prices. The “curse” is that when assets become highly correlated, there is no safe place to hide when something eventually breaks.
The first chart shows that gold has not risen due to debts, deficits, or inflation but rather speculative action. In fact, 2022 gold fell as inflation rose to 9%. With inflation falling and expectations of increased liquidity from the Federal Reserve, all assets have risen simultaneously over the last two years.
(Click on image to enlarge)
As noted, when something eventually breaks the S&P 500 and selling begins in earnest, all asset classes will likely revert from extended and overbought conditions. Such is the nature of highly correlated markets. Which brings us to the second chart.
In the last 50 years, there have only been three (3) other occasions when Gold was this extended, overbought, and deviated from long-term moving averages. As shown, Gold is currently trading four (4) standard deviations above its four-year moving average. Each time Gold has previously achieved such conditions, the eventual reversion was quite large.
(Click on image to enlarge)
While gold and stocks have put in a terrific performance this year, as is always the case, don’t forget to take profits.
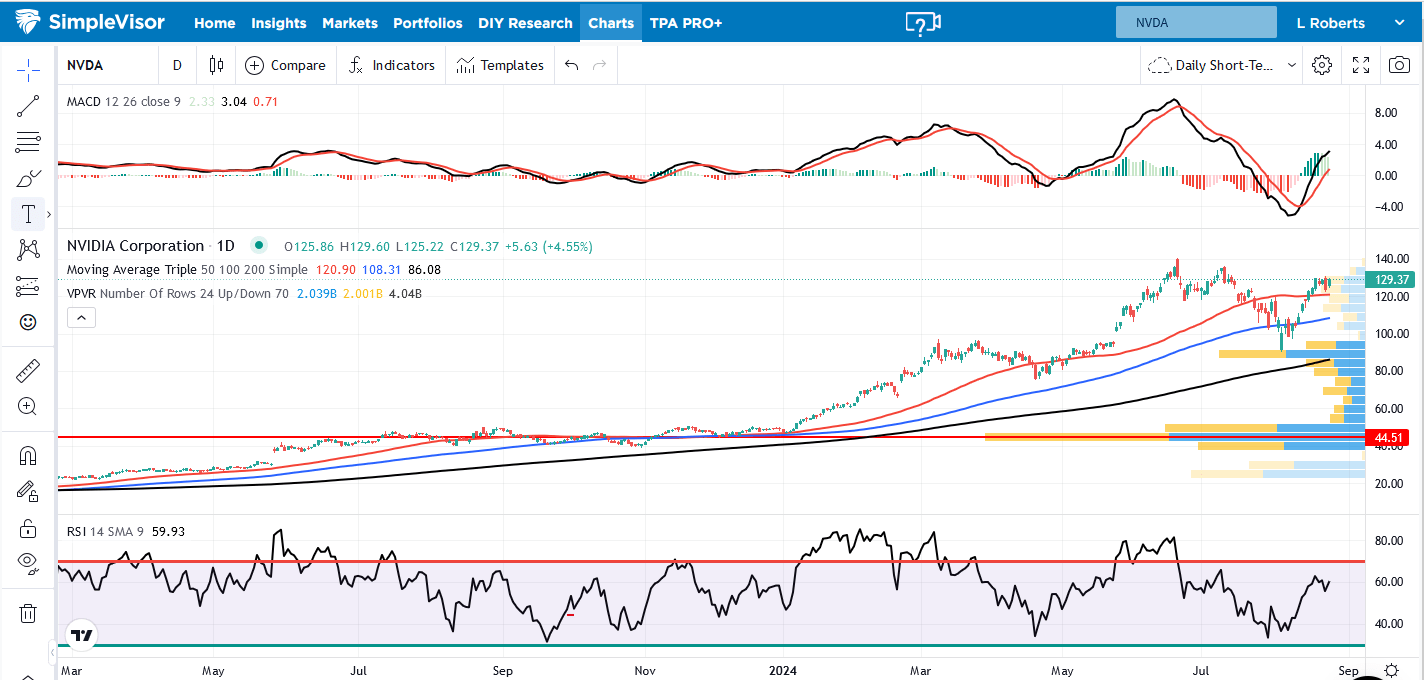
Nvidia Implied Move
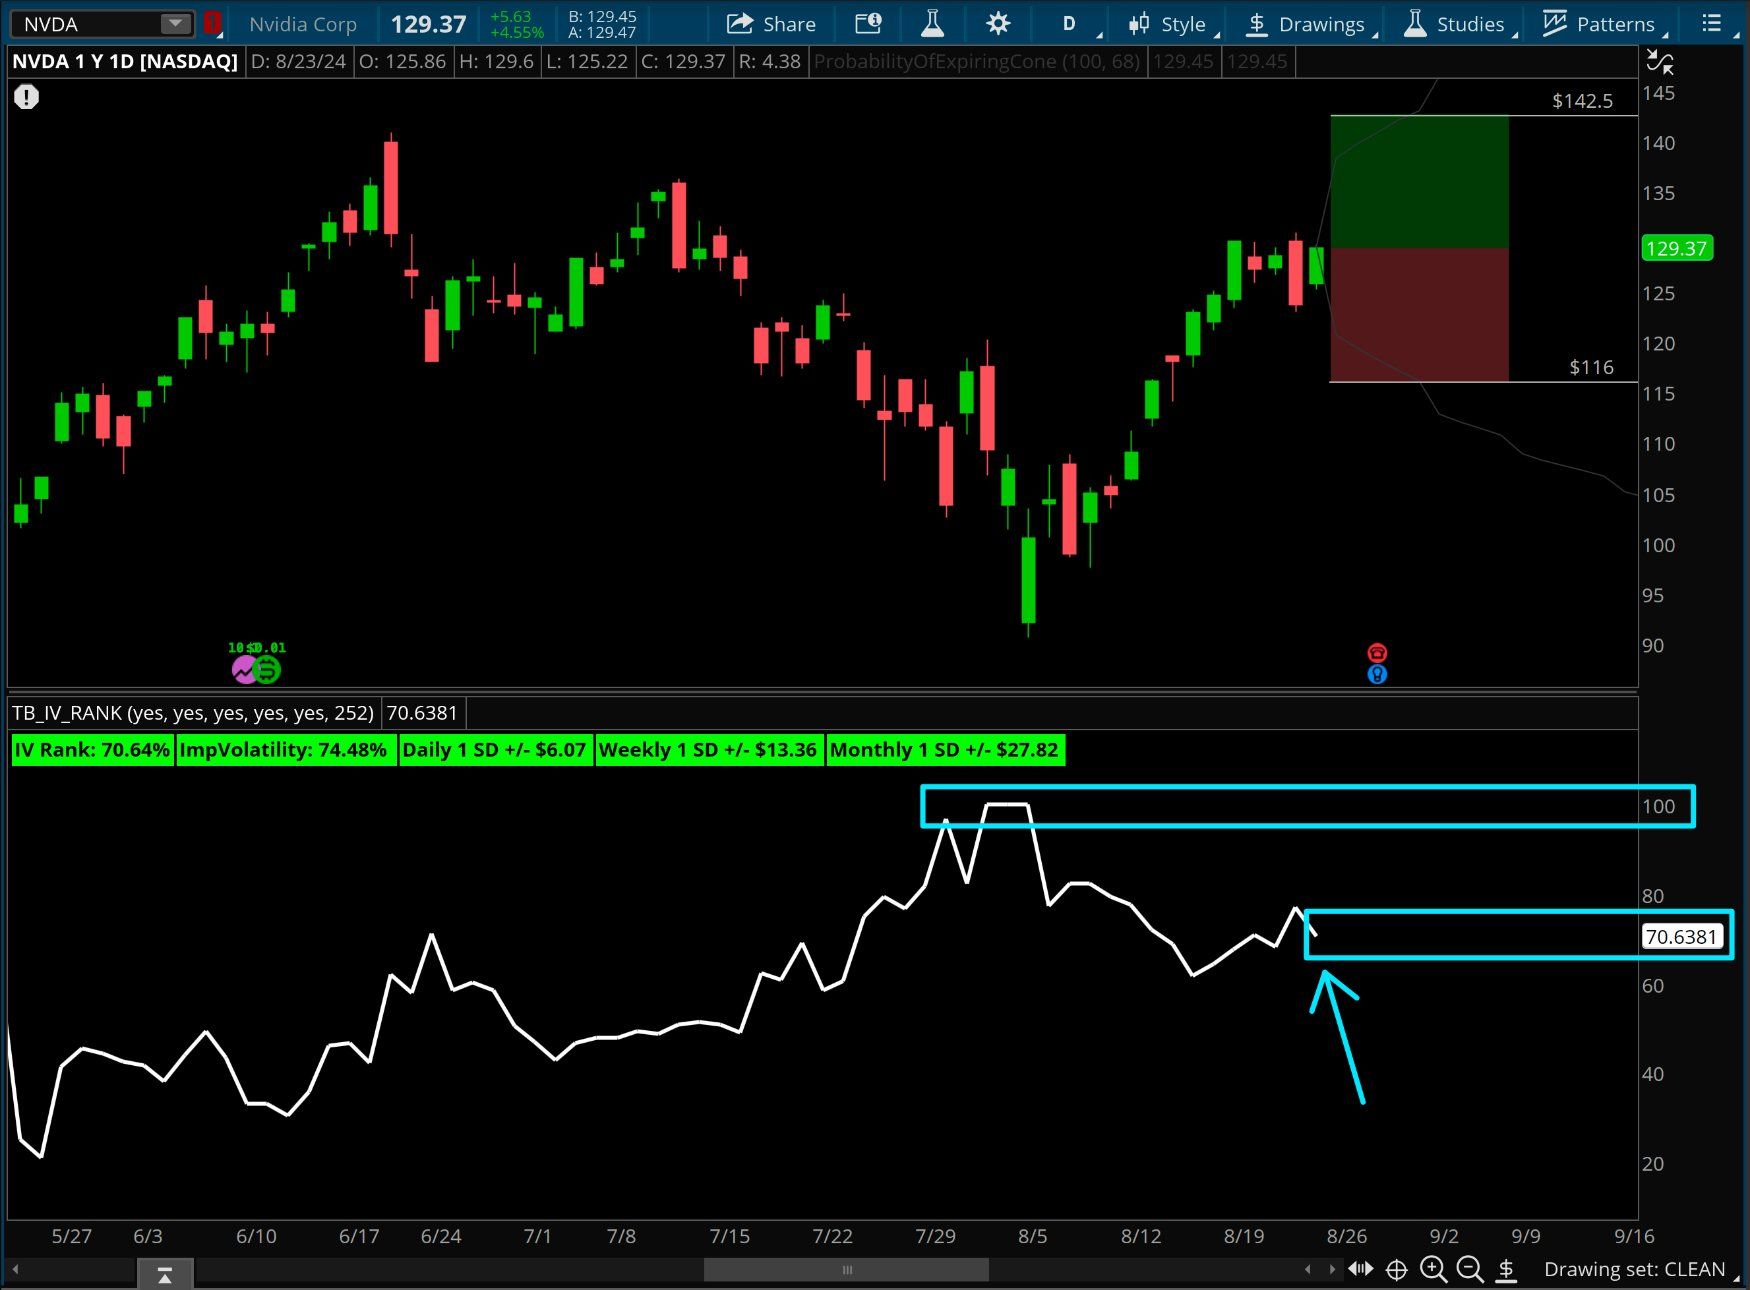
According to @unusual_whales, the options market implies that NVDA is likely to move by 10.09% on Wednesday when they announce their earnings. They claim this is the largest implied change going into earnings over the last ten quarters. It’s important to note that the implied move relates to volatility, not direction. Therefore, it implies the market thinks NVDA can rise or fall by 10% tomorrow. The first graph below highlights the potential move in red and green. Furthermore, the implied volatility is shown below the price graph.
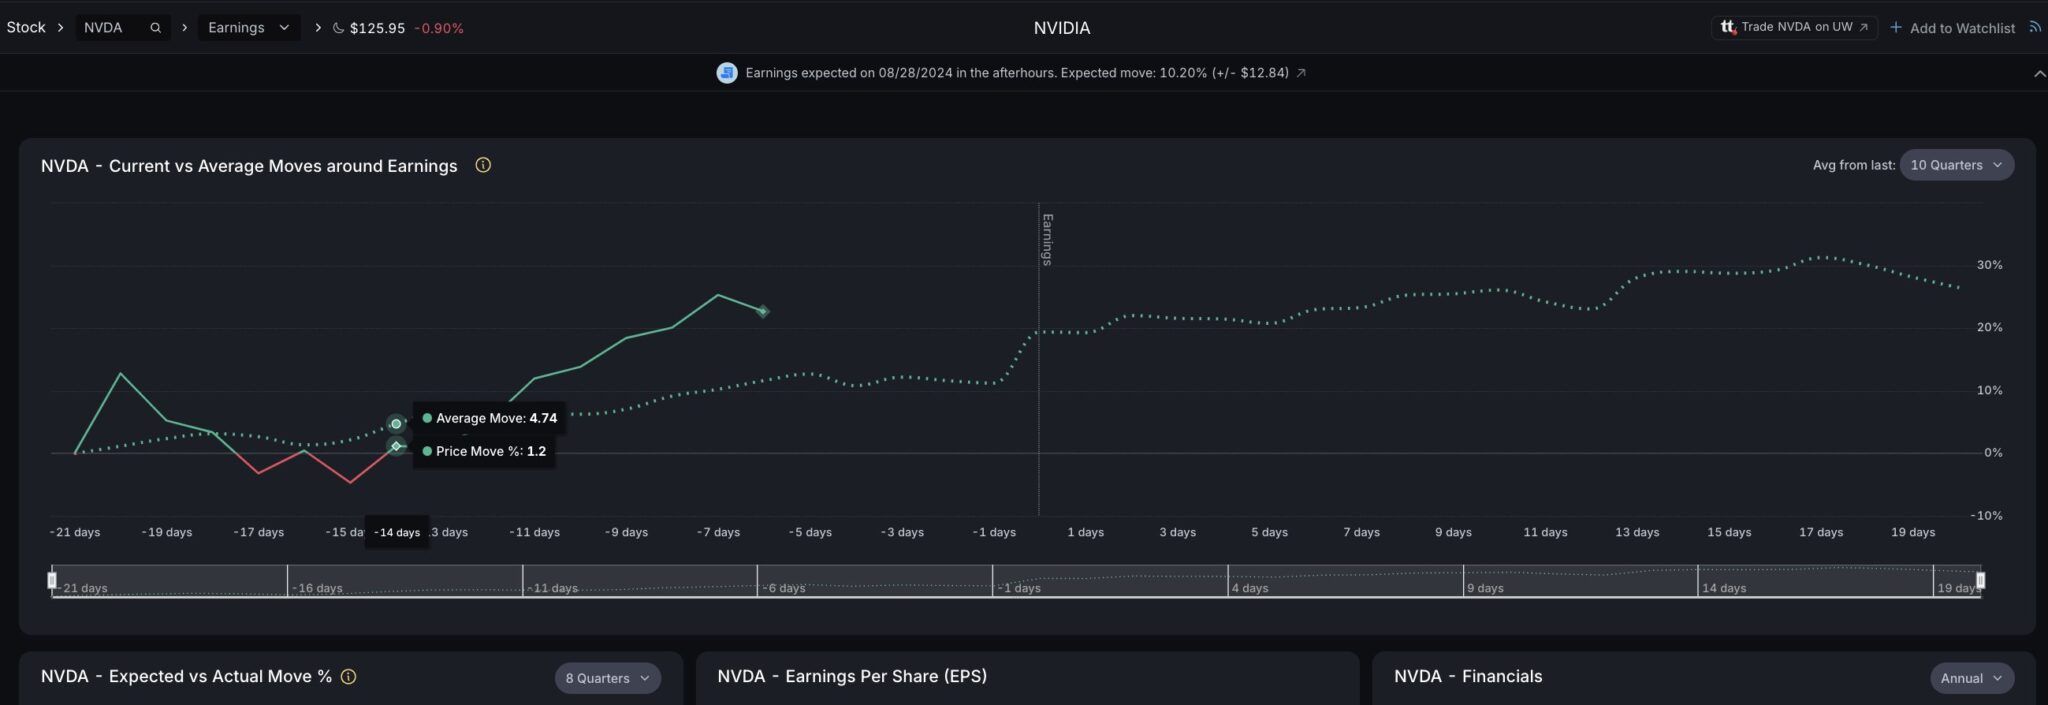
For context, the last two earnings reports generated gains of 16% and 9% on the day after the earnings release. In both cases, the stock continued higher for two to three more weeks before forming a short-term peak. The second graph below from Unusual_Whales charts the recent action in NVDA versus its average performance over the last ten earnings reports in the 20 days leading up to earnings and 20 days post earnings. Currently, it sits about 10% above the average. Moreover, it’s about 10% below the average for the entire 40-day period.
(Click on image to enlarge)
(Click on image to enlarge)
SimpleVisor Sector Analysis
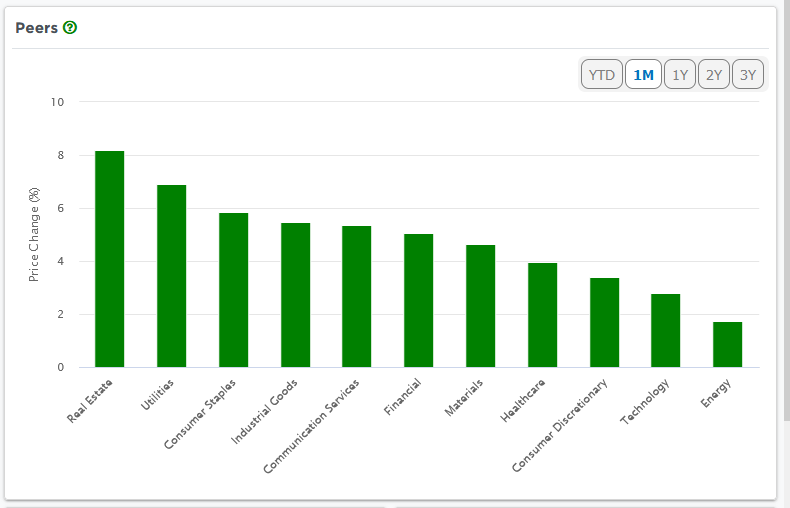
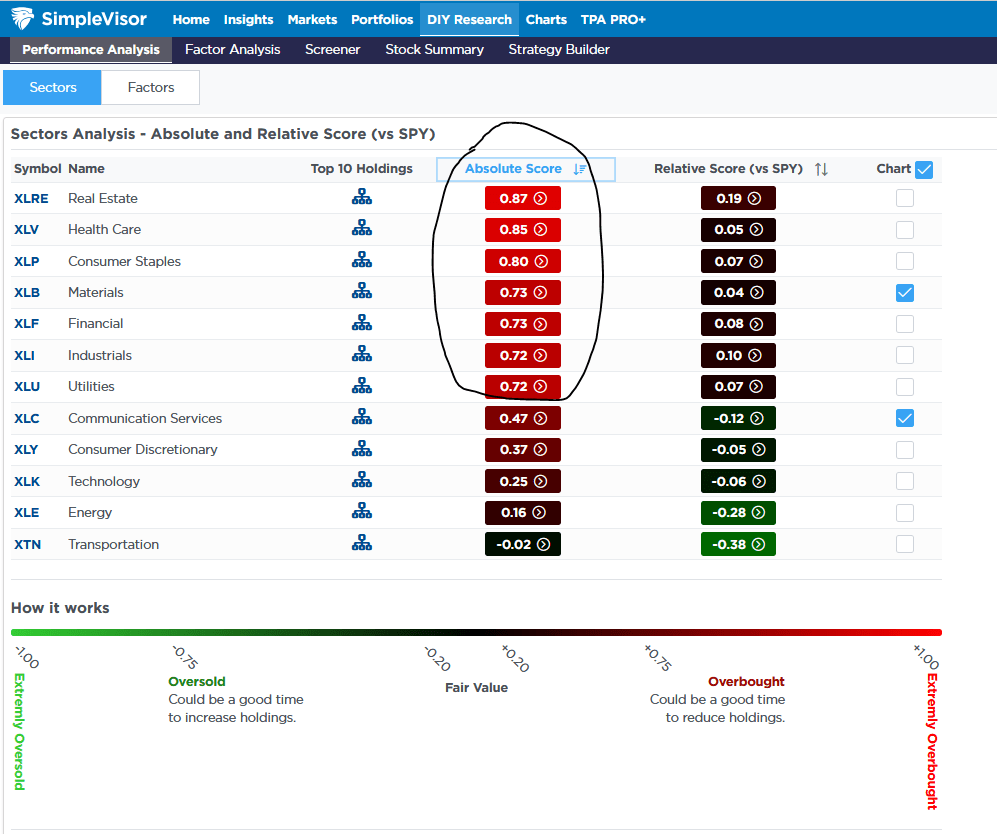
The first graph below, courtesy of SimpleVisor, shows that over the last month, the market breadth has been much more aligned than it had been. Real Estate and Utilities are the top performers, but their incremental gains over most other sectors is not large. Furthermore, Technology, which has been this year’s star sector, is underperforming. Clearly, breadth is much better today than at the market peak in mid-July.
The second table shows many sectors continue to have relative scores near zero. This tells us that the price ratio of each sector to the S&P 500 is near fair value on a technical basis. However, while the relative analysis does not offer much guidance, the absolute scores are concerning. As we highlight below, over half of the sectors have overbought absolute scores. Real estate and Healthcare are the most extreme. Likely we will see these sectors take a break from the recent steady rise. While the relative scores do not argue for a performance rotation, the absolute scores do.
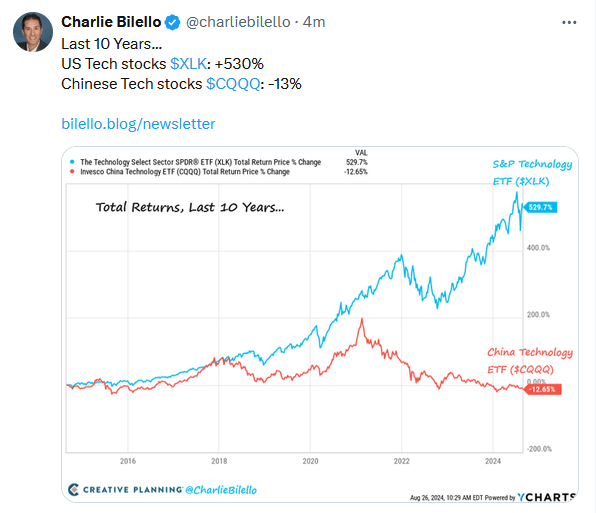
Tweet of the Day
More By This Author:
Powell Signaled Rate Cuts Are Coming
Bullish Signal Override Bearish Headlines...For Now
The CFNAI Bark Is Worse Than Its Bite


Comments
Log in or sign up to join the conversation.