
Although Gold Barely Moved, The GDXJ Took Bearish Action
The precious metals market appears to have topped. The fact that junior miners underperform gold serves as bearish confirmation that more downward waves may follow.
Almost everything I wrote and said yesterday also is still relevant today.
In Tuesday’s analysis, I wrote the following about the USD Index:
For example, the USD Index could decline to its strong support level at the 38.2% Fibonacci retracement and the August 2022 low as well as the May 2022 high. Such a move would likely imply the RSI at about 30, which would be a crystal-clear signal for many traders that the bottom is in.
To clarify, if that happened, the USD Index would be as oversold from a short-term point of view as it was at its 2021 bottom – when it was trading at about 90.
Despite the intraday attempt to move lower, the support held.
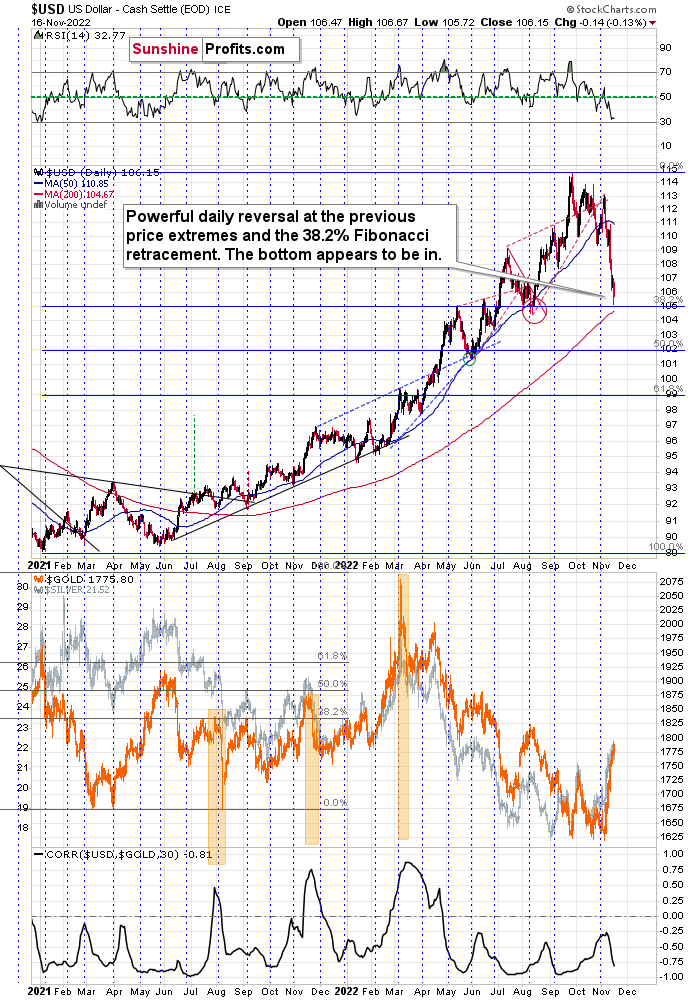
Consequently, what I wrote below the USDX chart yesterday remains up-to-date:
The USDX moved very close to the above-mentioned support levels, and it moved back up before the end of the day. The only reason that the RSI didn’t move to 30 is because the USDX declined only on an intraday basis. This means that from the RSI’s point of view, the situation is only “very bullish,” not extremely so. However, given the reversal nature of yesterday’s session, the outlook just became even more bullish, and it seems to me that the bottom is in.
This means that the top in the precious metals market is also likely in or at hand, especially given the S&P 500’s inability to break through its own 38.2% Fibonacci retracement.
Despite the USD Index closing a bit lower than on Tuesday, the GDXJ closed the day over 1% lower.
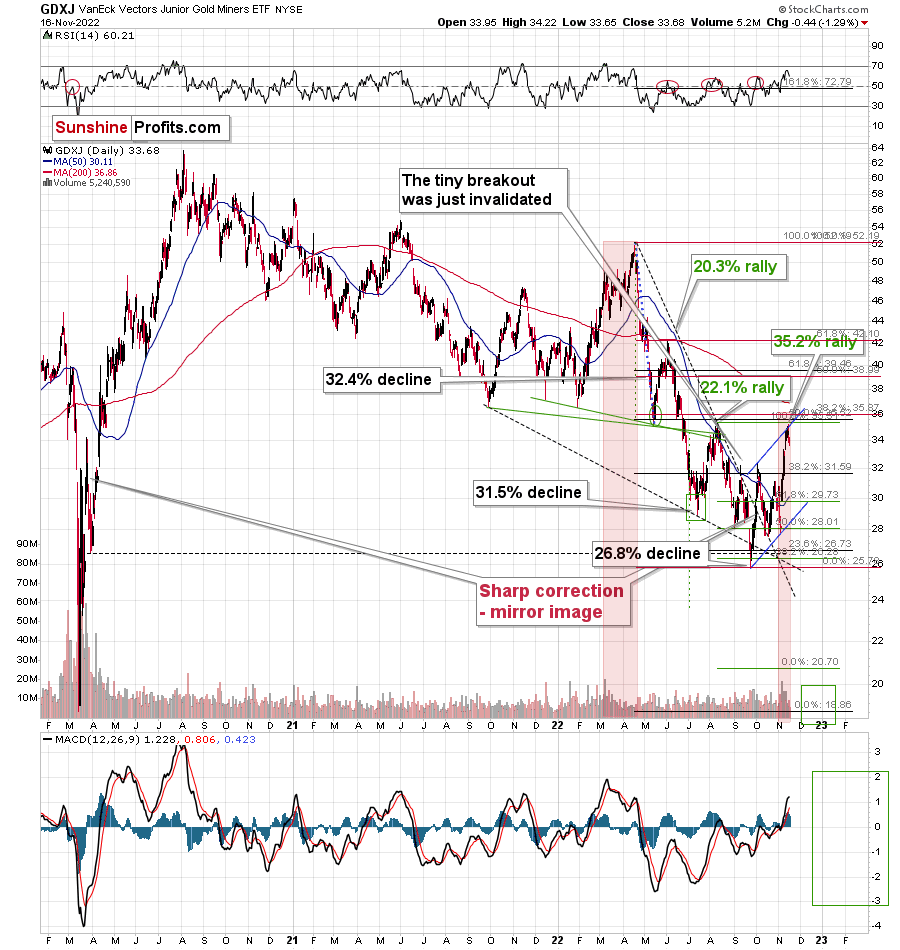
As I said and wrote earlier, the precious metals market appears to have topped.
Interestingly, it appears that the classic Elliott-wave pattern has just been completed and that a new massive wave down is about to take occur.
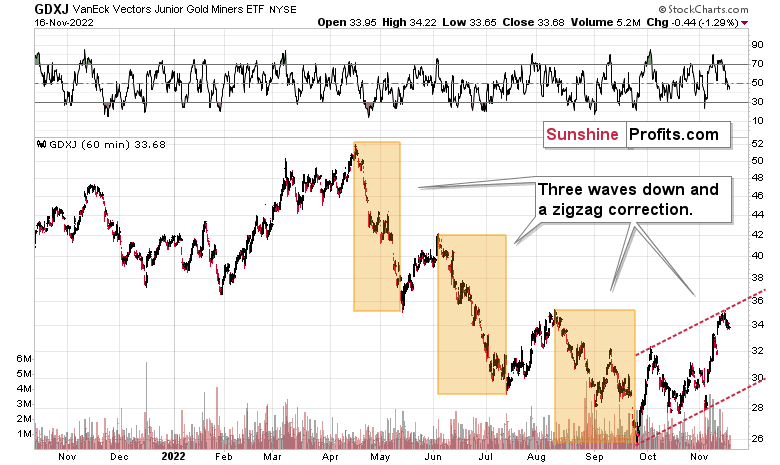
The classic EWT pattern is three waves down (I marked those with an orange rectangle) and then a correction consisting of two smaller waves.
That’s exactly what we have seen in recent months. The September–now pattern appears to be the above-mentioned correction. It didn’t only consist of two smaller waves higher – they were actually almost identical in terms of size and sharpness. This created a classic ABC correction (flag) pattern.
Now, since this pattern is complete, another huge 3-stage move lower can – and is likely – to unfold. This is very bearish for junior mining stocks (as well as for gold, silver, and probably other commodities and stocks), and the fact that juniors are already showing weakness relative to gold (the latter was almost flat yesterday, while miners declined) serves as a bearish confirmation. As always, I can’t guarantee anything, but in my view, the profits that can be reaped on this upcoming slide can be enormous.
More By This Author:
The Gold Market: Is It A Peak Before A Big Fall?
Silver Moved Higher: Can It Be Consider Bullish?
Gold Price Upswing: Have We Really Reached Peak Inflation?
Disclaimer: All essays, research and information found on the Website represent the analyses and opinions of Mr. Radomski and Sunshine Profits' associates only. As such, it may prove wrong ...
more

