
Claims Back To Normal
Initial jobless claims for this week were forecasted to come in slightly lower at 220K from last week’s print of 222K. The actual decline was even larger with claims coming in at 214K and last week’s number was revised up by 1K. Claims have now essentially reversed the massive spike observed around Thanksgiving and are back within the range that has been in place for most of the past year. Although we were hesitant to take November’s spike up to 252K at face value (which have still not experienced any revision), the four-week streak of declines from these levels has marked the longest streak of weeks with consecutive declines since a five-week streak that came to a close in April of last year. Additionally, the 38K decline off of that 252K peak has marked the largest four-week decline for claims since September of 2017 when they had fallen 43K from 300K to 257K (second chart below).
(Click on image to enlarge)

(Click on image to enlarge)

Although the four-week moving average is helpful in smoothing out the week to week fluctuations in claims data, the outlier of 252K several weeks ago has had an effect on elevating the average in recent weeks. This week, that high print has rolled off the average, and the moving average has finally declined week-over-week for the first time since November. After reaching a 52-week high of 233.5K last week, the moving average has fallen 9.5k to 224K. That is the largest one week decline in the moving average since September of 2017 when it had fallen 10.75K. While that is a drastic improvement from where things have been, the average is still somewhat elevated relative to where it has been over the past year.
(Click on image to enlarge)

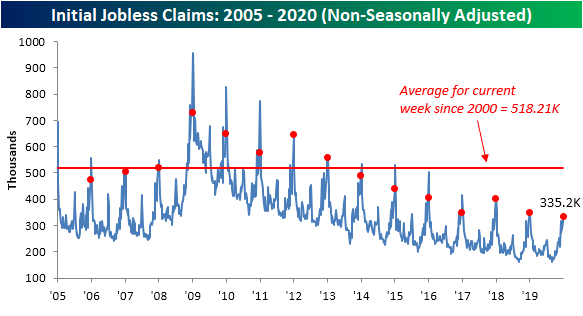
The non-seasonally adjusted data is echoing this as this week’s print shows a still strong labor market. The first or second week of the year has marked the seasonal peak for non-adjusted claims just about every year of the past two decades. So while claims by this measure rose to 335.2K due to seasonal factors, and assuming a higher peak does not get put in place next week, this year’s high would be 15.7K lower than last year’s peak of 350.9K. Although this isn’t as much of an improvement as we’ve seen in prior years (second chart), we’re working with a much lower base now than we were in years past.
(Click on image to enlarge)
(Click on image to enlarge)

Start a two-week free trial to Bespoke Institutional to access our interactive economic indicators monitor and much ...
more

