
Buyback Blackout Periods Do Not Negatively Impact Market Performance
The October 2018 market correction where the S&P 500® Index fell by 7%, its worst October since 2008,(1) left investors searching for a culprit. Some of the usual suspects were blamed — rising geopolitical tensions ahead of the US midterms, the high likelihood of a slowdown in economic and earnings growth after the sugar rush of fiscal stimulus and tighter monetary policy leading to higher rates and investors discounting stocks’ future cash flows at that higher rate.
Non-market based theories were floated as well. ETFs were placed at the helm of a ship making a hard downward turn, but that theory didn’t pass the muster of math, as pointed out in a prior research piece.(2)Another theory held that the market’s sudden dips were caused by companies’ inability to buy back shares ahead of their earnings announcements.(3)
This is an interesting theory and one we haven’t really come across before, as the impact of buybacks on stock prices and shareholder value, both in the long and short term has been well documented. Among many other reports, “The Case for Stock Buybacks” by Edmans [2017] addresses the long term effects(4) while “The Share Repurchase Announcement Puzzle: Theory and Evidence” by Bhattacharya and Jacobsen [2016] covers the short term.(5)
As a refresher, buybacks are when a company purchases its own stock in the public market for reasons that range from managing capital allocations between debt and equity to returning cash to shareholders.(6). Some companies temporarily suspend share buyback programs during earnings blackout periods. These periods typically start a few weeks(7) prior to reporting and end a few days after the earnings release.
Under the buyback blackout theory, performance is anticipated to decline because firms cannot buy back shares before earnings releases, depressing price support as a possible persistent buyer has temporarily left the market. Given the attention this theory received in the media during the 2018 third quarter earnings season, we decided to take a closer look. Our analysis here is not meant to produce an empirical trading model or refute the economic impact of firms conducting buybacks. Nor is it to say that, during earnings season, going long firms that have been known to buy back their shares in bulk provides a source of uncompensated alpha. Rather, we offer data-driven insights to answer the pundit’s question of whether the market falls during earnings “blackout” periods.
Does the Buyback Blackout Period Theory Hold Any Water?
Buybacks have been a common target for market prognosticators theorizing why large-cap US equities have hit multiple new all-time highs in recent years. With so much attention on the way up, attention on the way down is just natural. A July 2018 headline captures the most extreme view on buybacks and market impact “Companies buying back their own shares is the only thing keeping the stock market afloat right now.”(8) Examining the historical relationship between buybacks and market returns provides useful insight into this narrative.
While Bhattacharya and Jacobsen [2016] examined the effect of buyback announcements, suggesting the announcement impact effect was between 1% and 2% on average, we are focused on the buying of shares and its broader impact. Determining the precise impact on returns is difficult given the number of variables to consider (date, size, frequency, trading strategy). Therefore, we seek to examine the relationship based on historical return patterns and the amount of shares being purchased as a percent of market cap. We find the linkage between the two to be low, indicating that the rise in equity values over the past few years has not been a direct result of an increase in buybacks — a view shared by Asness, Hazlekorn, and Richardson [2018] “Buyback Derangement Syndrome.”(9) Figures 1 and 2 represent this seemingly uncorrelated relationship.
Figure 1 depicts the S&P 500 Index closing value versus the quarterly buyback amounts by S&P 500 firms aggregated on a monthly basis from FactSet. Looking at this chart, one would most certainly conclude that there is a linear relationship between buybacks and the movement in stock prices. After all, buybacks hit an all-time high at the same time the S&P 500 did in 2018. But looking at the total notional figure of buybacks is distorted by the fact that companies over time have gotten bigger. We present this analysis to show how and why the buyback narrative can gain traction, as there appears to be a correlation.
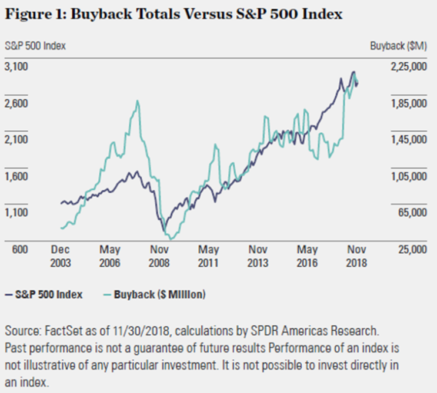
But the devil is in the details. Presenting buyback amounts as a percent of market cap allows for a fairer comparison, as it shows the size and scale of share repurchases. If firms were buying back 10% or 20% of market value a year, it should have an impact on prices. However, we find that, on average, firms purchase approximately 3%, a figure unlikely to distort prices. And when normalizing the buyback amounts by market capitalization, we see that there is actually less of a relationship.
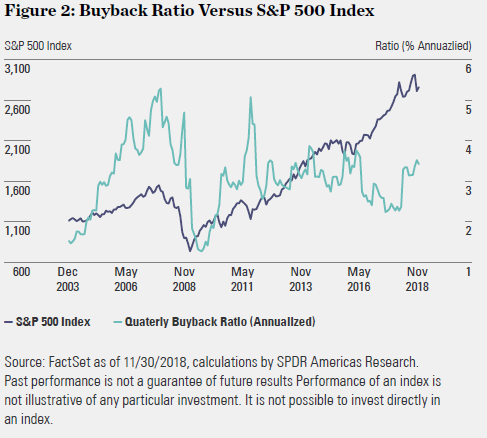
Figure 2 depicts the normalized buyback ratio (total S&P 500 buyback amount as a percent of S&P 500 market capitalization, annualized). While the dollar figure had a 77% correlation to the S&P 500 Index, the ratio has only a 5% correlation. This data refutes the argument posed above that companies buying back their own shares are the only thing keeping the stock market afloat right now.
But is there any value associated with the theory of market drawdowns occurring because firms temporarily suspend buybacks? And if the market falls again prior to another earnings season, will buybacks be identified as the smoking gun? To put this to test, we conducted an analysis of the top quintile of firms in the S&P 500 Index with the highest buyback ratio. The working theory is that if buyback blackout periods do lead to stock market declines, then the firms buying back the most shares would suffer the most as they would not be in the market purchasing shares. Correspondingly, there should be a rally post blackout period when the companies can once again purchase shares. Let’s consider this our null hypothesis, with the alternative hypothesis being that returns of the tested quintile of stocks are mostly random.
Our results indicate we should reject the null hypothesis, as we found no significant difference in returns in any of the periods measured of heavy buyback program firms, suggesting it is unlikely the Buyback Boogeyman strikes during blackout periods.
Test Parameters to Debunk the Buyback Blackout Theory
Our dependent variable in this test was the S&P 500 Buyback Index, an equal-weighted selection of the 100 companies within the S&P 500 with the highest buyback ratios over the past 12 months, rebalanced quarterly. A buyback ratio is defined as the monetary amount of cash paid for common shares bought back in the last four calendar quarters, divided by the total market capitalization of common shares at the beginning of the buyback period.
Since earnings releases typically occur regularly throughout the year, we used chain-linked date ranges that had a significantly large amount of earnings releases to provide ample coverage of firms reporting over different time periods throughout different calendar years. The dates selected are the time periods that had releases one standard deviation above the average number of earnings releases each day over the date range. Given that earnings season can last for many months, we wanted to have a representative data set that was comprehensive but also targeted. We acknowledge that there could be overlap within this data set where firms may no longer be buying back shares or, have yet to report and are buying with both hands. So there could be some selection bias within this analysis, but then again the buyback blackout period theory foundations appear to be anecdotal at best.
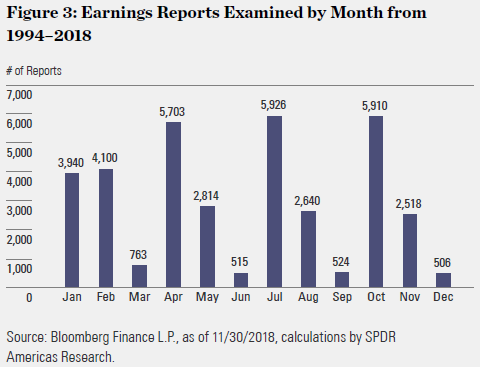
As shown in Figure 3, it easy to see where earnings reports are clustered, historically. This provides context to the time periods examined within our data sets.
These dates were then aggregated from 8,981 days to form three separate 136 month (N) chain-linked ranges: the month of releases, month prior, and month after earnings releases. With this data in hand, we performed five distinct tests using monthly return data from March 31, 1994 to October, 31, 2018.
We first naively tracked returns over our date ranges versus the S&P 500 Equal Weighted Index to find the number of days with positive or negative excess returns. For this test we used the equal weighted S&P 500 as the buyback exposure is also equally weighted, so we sought to provide a more equivalent comparable.
To add rigor to our tests, we regressed the returns of the chain-linked ranges for S&P 500 Buyback over the three periods:
- Months prior against independent variables, the Fama- French Factors (High Minus Low (HML), Small Minus Big (SMB), Robust Minus Weak (RMW), Conservative Minus Aggressive (CMA), Market Premium (MKT_RF). We use the standard 0.05 as our significance level the regressions and we are assuming this is a two-sided test since there can be underperformance or outperformance
- Months during with the same independent variables
- Months after with the same independent variables
We then ran a factor-based performance attribution for the last two earnings seasons, given the amount of articles written last October, to see if this theory is a result of recency bias. This analysis was run on the S&P 500 Buyback Index versus S&P 500 Equal Weighted Index, using the Bloomberg US Equity Fundamental Model.(10)
Results Reject the Null, Indicating Buyback Blackout Theory is Noise, Not News
The results of our tests indicate no strong linkage between buybacks and any performance degradation during blackout periods for companies with large buyback programs. As depicted by the following tests given that the firms with the most buybacks didn’t produce significant negative alpha, it’s hard to conclude blackout periods are a harbinger for market declines.
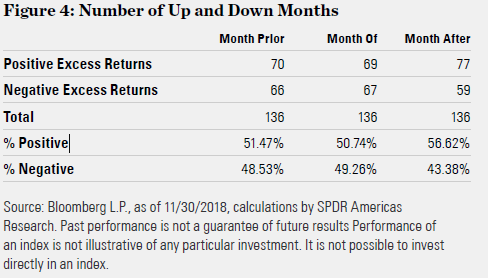
Test 1: Number of Up and Down Months
Our first test shows the lack of a connection between buybacks and any performance degradation during blackout periods quite simply. Figure 4 shows the number of months in each chain-linked date range that had either positive or negative performance. Out of the 136 months analyzed, it was nearly an even split between positive and negative excess returns for the S&P 500 Buyback Index over the S&P 500 Equal Weighted Index. In fact, there were more positive months of excess returns prior to earnings releases, conflicting with the buyback blackout period theory. The “month of” analysis is also important, given the potential for overlap as discussed above. This time period is also in direct conflict with the theory, as returns were positive.
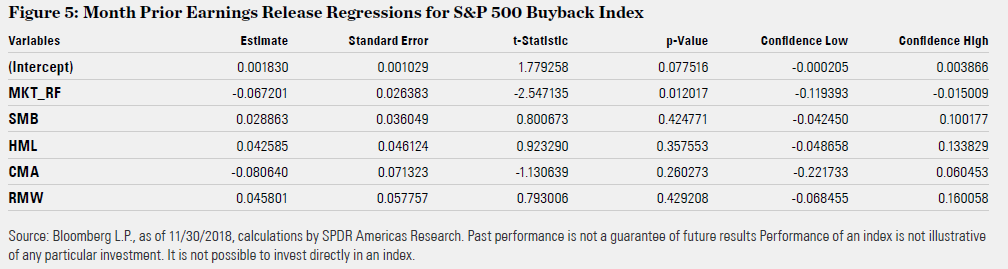
Test 2: Month Prior Earnings Release Regressions for S&P 500 Buyback Index
Figure 5 shows the regression output of the S&P 500 Buyback Index and the Fama-French Factors over the date range before earnings releases. The estimate column represents alpha and beta coefficients of the factors. Based on the p-value, which is greater than 0.05 (our chosen level of significance) the residual alpha shown here (intercept of the estimate) is not significant. None of the factor intercepts are significant either. The interesting result here is that there was actually positive alpha generated, albeit insignificant positive alpha, and not negative alpha as the theory would indicate.
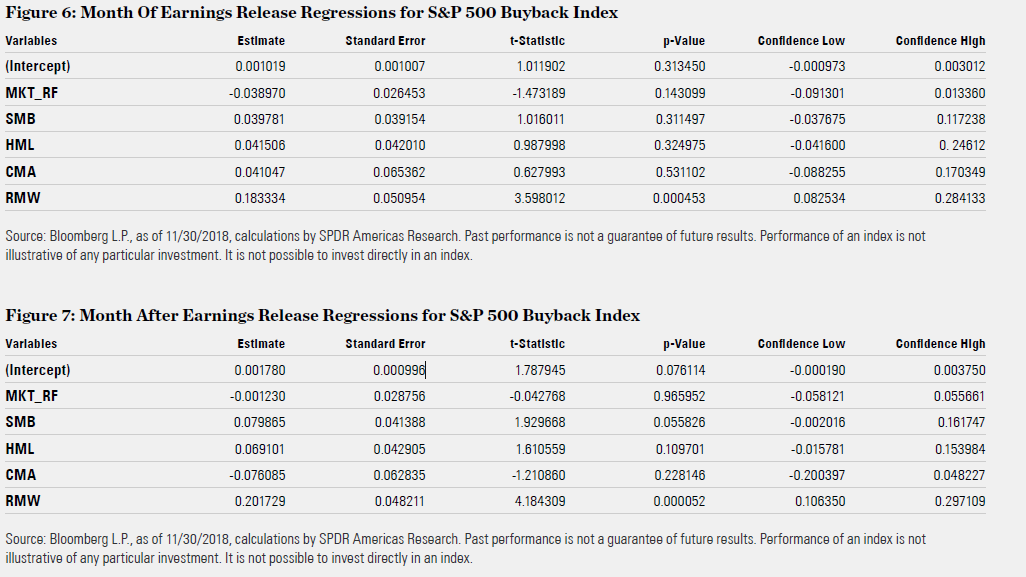
Test 3: Month Of Earnings Release Regressions for S&P 500 Buyback Index
Figure 6 shows the regression output of the S&P 500 Buyback Index and the Fama-French Factors over the date range of earnings releases during the months of the releases. Once again, the p-Value of the intercept (alpha) is above 0.05, indicating no statistical significance of the alpha generated during the month of earnings reports.
Test 4: Month After Earnings Release Regressions for S&P 500 Buyback Index
Figure 7 shows the regression output of the S&P 500 Buyback Index and the Fama-French Factors over the date range after earnings releases. Once again, the p-Value of the intercept (alpha) is above 0.05, indicating no statistical significance of the alpha generated after the month of earnings reports. This refutes the idea that firms with heavy buyback programs would rally once they could start buying back their shares again if they had suffered during a blackout period.
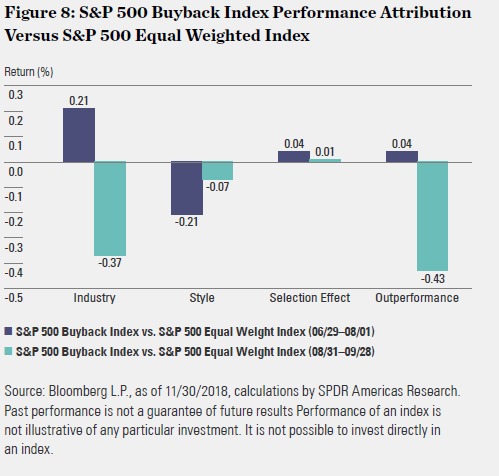
Test 5: Performance Attribution S&P 500 Buyback Index Against S&P 500 Equal Weighted Index
We ran factor based attribution tests using Bloomberg’s US Equity Fundamental Model, analyzing the S&P 500 Buyback Index against S&P 500 Equal Weighted Index. We selected a couple months prior to the start of Q3 2018 as firms should begin to wind down buybacks in time for earnings releases. The selected date ranges were June 29 — August 1, 2018 and August 31 — September 28, 2018, mirroring potential blackout periods. The S&P 500 Buyback Index both outperformed and underperformed the S&P 500 Equal Weighted Index. The S&P 500 Buyback Index beat the S&P 500 Equal Weighted Index by 0.04% in the former period and fell -0.43% in the latter.
Style and industry returns were the main drivers of return differences, with stock selection effects being positive in both cases, as shown below. As stock specific factors were positive, indicating firms with heavy buyback programs outperformed, it would be hard to claim that company blackout periods would result or be an accelerant to market selloffs.
Don’t Buy the Buyback Blackout Period Theory If the Market Falls Next Earnings Season
If buybacks were the cause of the market correction, we would expect to see poor performance before earnings announcements. Looking at the dates surrounding releases, there is no evidence of worse performance around earnings season. Broadening our scope, the regressions show residual alpha in each time period. The residual alpha should be taken with a big grain of salt since the regressions do not show significance across any time period.
Therefore, during these blackout periods, the returns for S&P 500 Buyback Index, the top quintile of S&P 500 firms buying back their shares, are most likely idiosyncratic. With quarterly earnings right around the corner, don’t blame the Buyback Boogeyman if the market sells off again.(11)
- The views and opinions expressed herein are those of the author and do not necessarily reflect the views of Alpha Architect, its affiliates or its employees. Our full disclosures are available here. Definitions of common statistics used in our analysis are available here (towards the bottom).
- Join thousands of other readers and subscribe to our blog.
- This site provides NO information on our value ETFs or our momentum ETFs. Please refer to this site.
References
| 1. | ↑ | Bloomberg Finance L.P., as of 10/31/2018. |
| 2. | ↑ | Mathew Bartolini, “Before You Ask, the Market Sell-off Wasn’t ETFs’ Fault, SPDR Blog, spdrs.com, October 12, 2018. |
| 3. | ↑ | Tae, Kim, “Here’s another theory for this week’s market skid — buyback blackout,” CNBC, October 11, 2018. |
| 4. | ↑ | Edmans, A. “The Case for Stock Buybacks.” Harvard Business Review, September 15, 2017. |
| 5. | ↑ | Bhattacharya, U., and Jacobsen, S. “The Share Repurchase Announcement Puzzle: Theory and Evidence.” Review of Finance, Vol. 20, No. 2 (2016), pp. 725-758. |
| 6. | ↑ | see here and here for some pieces on the subject by AA |
| 7. | ↑ | Under Securities and Exchange Commission’s (SEC) Rule 10b–18 companies also need to consider corporate trading windows when repurchasing stock. The length is variable, but typically is a few weeks prior to announcement. |
| 8. | ↑ | Jeff Cox, “Companies buying back their own sharesis the only thing keeping the stock market afloat right now,” CNBC, July 2, 2018. |
| 9. | ↑ | Asness, C, and Richardson, S, and Hazelkorn, T. “Buyback Derangement Syndrome” January 5, 2018. |
| 10. | ↑ | The model employs a multiple factor modeling approach, which allows a responsive yet stable assessment of major risk factors affecting US equity assets and portfolios. The main characteristics of the Bloomberg US Fundamental Equity Model are: Coverage of over 20,000 US equity securities with model start date 1999. 40 industry factors based on Bloomberg Industry Classification System (BICS). 10 style factors and idiosyncratic risk modeling based on a separate structural factor model which incorporates additional variables useful for dissecting non-factor risk. |
| 11. | ↑ | ID15245-2357077.1.1.AM.RTL 0119 Exp. Date: 01/31/2020 |
Join thousands of other readers and subscribe to our blog.
Disclaimer: Please remember that past performance is not an indicator of ...
more

