
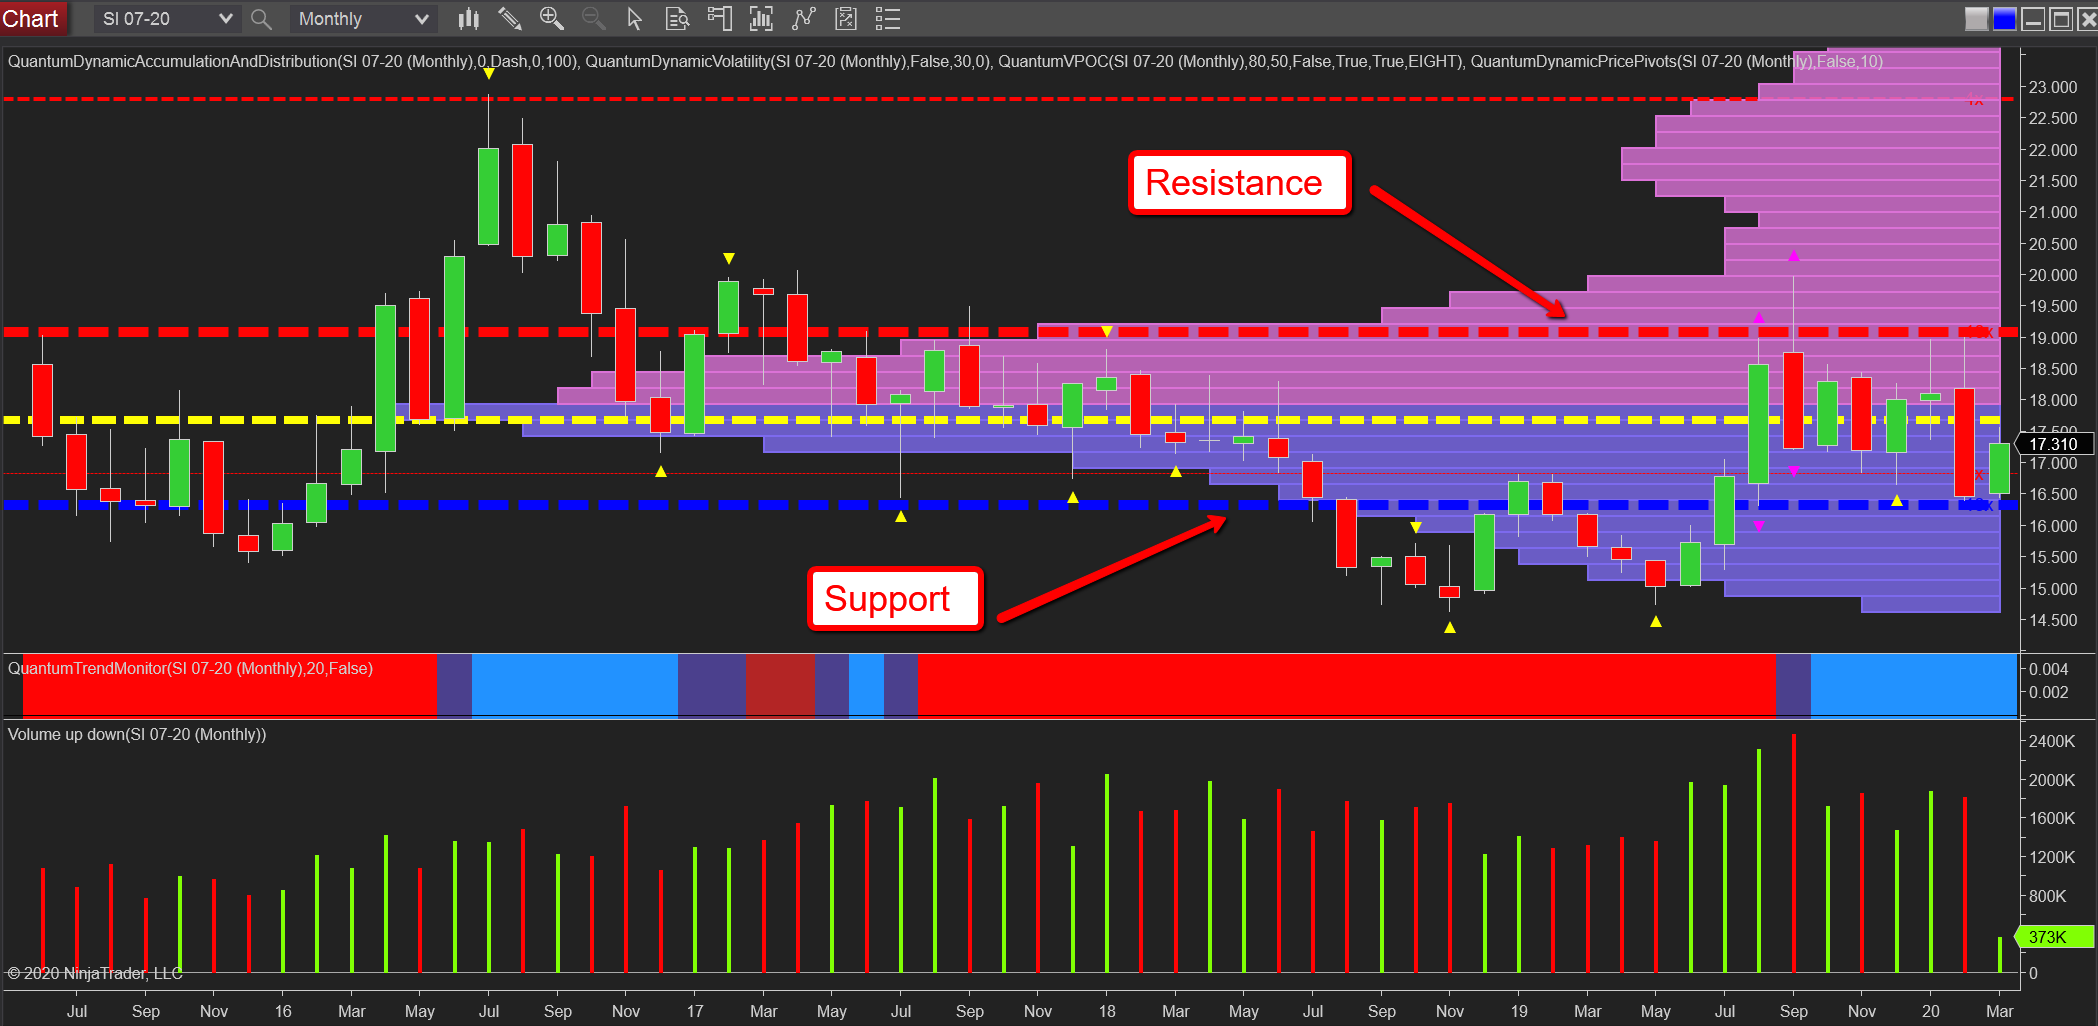
Whilst gold is on a tear at the moment, I thought it would be interesting to check out the monthly chart for silver, to see what is in store for the industrial metal. And it’s a very different picture. There is no breakaway from congestion, no strong base built, and no dramatic surges through resistance areas. Indeed, the monthly chart for silver resembles that for gold some years ago and suggests we have considerably more congestion to follow before silver follows on a similar meteoric path higher. The channel being built is clear, with heavy resistance at $19 per ounce with the red dashed line of the accumulation and distribution indicator, and equally strong support below at $16.40 per ounce, denoted with the blue dashed line of the same indicator, with the VPOC itself sandwiched between.
So where next for silver and will the strength of gold pull it higher? And in the short term, I believe the answer is no. Given the strength in the precious metal, the move for silver has been modest by comparison, and $19 per ounce seems some way off in the short term. Longer-term it may be breached, but my feeling is we are likely to see further congestion for silver rather than any strong trend develop just yet. It will come, but not for the next few months at least. And the dizzy heights of $23 per ounce are still a long way off yet!
Chart from NinjaTrader and indicators from Quantum Trading.


Comments
Log in or sign up to join the conversation.