
Business Cycle Indicators, Mid-November
With industrial production continuing its dive in October, we have a mixed picture of economic activity.
(Click on image to enlarge)
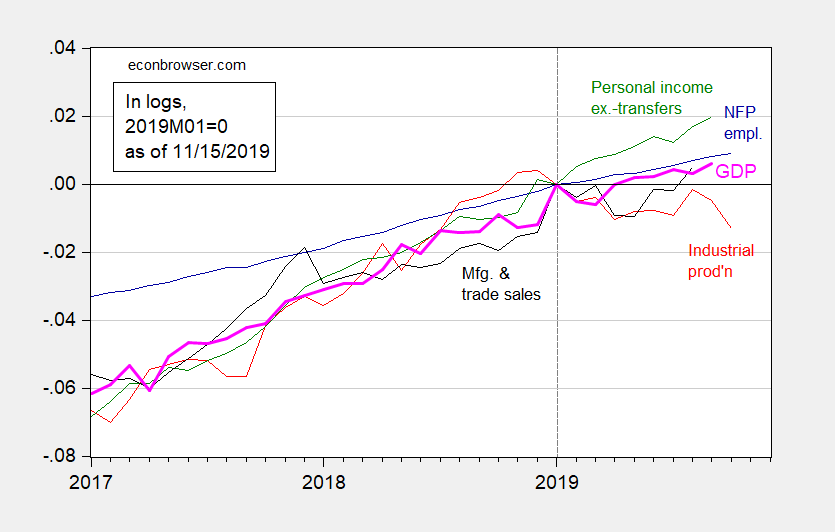
Figure 1: Nonfarm payroll employment (blue), industrial production (red), personal income excluding transfers in Ch.2012$ (green), manufacturing and trade sales in Ch.2012$ (black), and monthly GDP in Ch.2012$ (pink), all log normalized to 2019M01=0.Source: BLS, Federal Reserve, BEA, via FRED, Macroeconomic Advisers (10/28 release), and author’s calculations.
Disclosure: None.
How did you like this article? Let us know so we can better customize your reading experience.

Comments
Leave a comment to automatically be entered into
our contest to win a free Echo Show.

