

Image source: Unsplash
Industrial production comes in under consensus. Here’s a picture of the key indicators followed by the NBER BCDC.
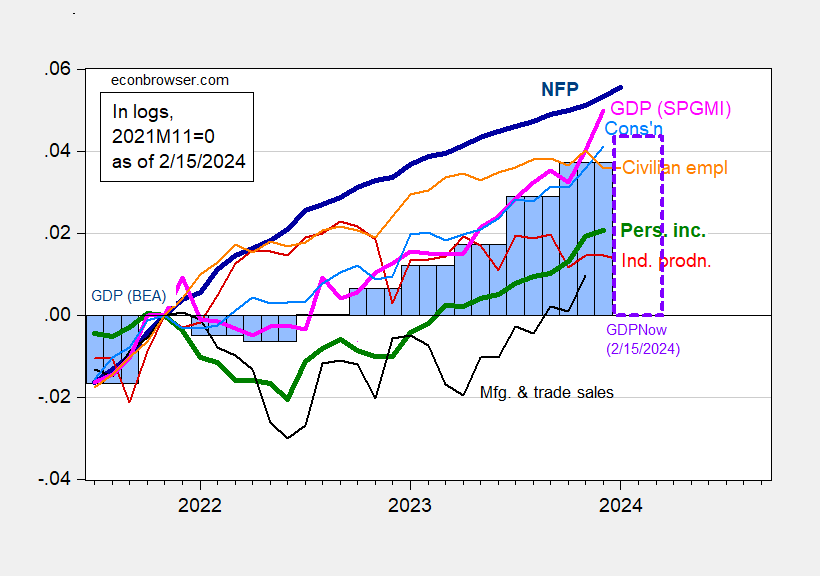
Figure 1: Nonfarm Payroll employment incorporating benchmark revision (bold dark blue), civilian employment (orange), industrial production (red), personal income excluding current transfers in Ch.2017$ (bold green), manufacturing and trade sales in Ch.2017$ (black), consumption in Ch.2017$ (light blue), and monthly GDP in Ch.2017$ (pink), GDP, 3rd release (blue bars), GDPNow for 2024Q1 as of 2/15 (lilac box), all log normalized to 2021M11=0. Source: BLS via FRED, BLS preliminary benchmark, Federal Reserve, 2023Q4 advance release,, S&P Global Market Insights (nee Macroeconomic Advisers, IHS Markit) (2/1/2024 release), and author’s calculations.
More By This Author:
Output Gap MeasuresInflation Expectations Down
Inflation: January 2024


Comments
Log in or sign up to join the conversation.