Business Cycle Indicators At The Start Of 2024

Image source: Pixabay
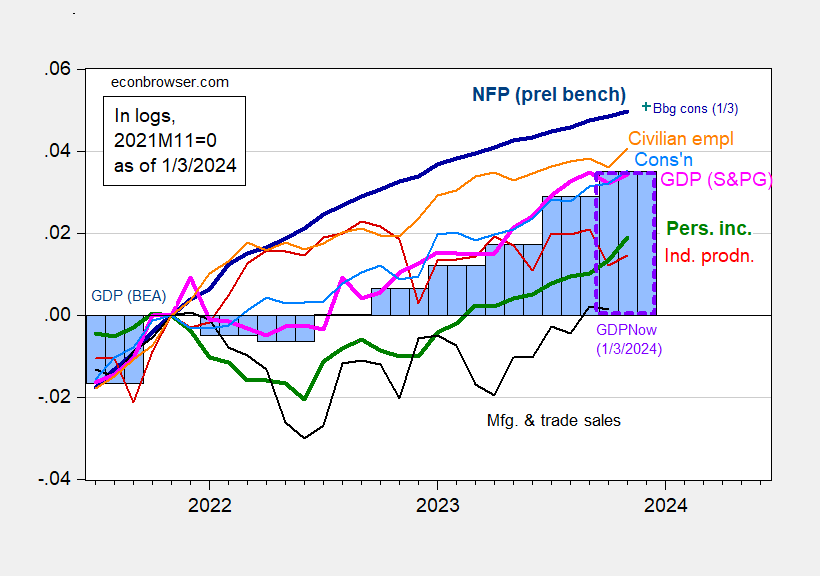
November monthly GDP is reported by S&P Global Market Insights, up 0.2 ppts, 2.6% annualized. Here’s the picture of some key indicators followed by the NBER Business Cycle Dating Committee, plus monthly GDP and GDPNow.
Figure 1: Nonfarm Payroll employment incorporating preliminary benchmark (bold dark blue), implied level using Bloomberg consensus as of 1/3 (blue +), civilian employment (orange), industrial production (red), personal income excluding transfers in Ch.2017$ (bold green), manufacturing and trade sales in Ch.2017$ (black), consumption in Ch.2017$ (light blue), and monthly GDP in Ch.2017$ (pink), GDP, 2nd release (blue bars), and GDPNow for 2023Q4 as of 1/3 (lilac box), all log normalized to 2021M11=0. Source: BLS via FRED, BLS preliminary benchmark, Federal Reserve, BEA 2023Q3 2nd release incorporating comprehensive revisions, S&P Global/IHS Markit (nee Macroeconomic Advisers, IHS Markit) (1/3/2024 release), Atlanta Fed, and author’s calculations.
Bloomberg consensus is for +163K NFP growth.
As of today, GDPNow for Q4 is 2.4% (q/q SAAR), S&P Global Market Insight is 0.9%, and GS at 1.4%. (NY Fed Q4 nowcast is 2.4%, while St. Louis Fed’s is 1.9%, both as of 12/29.)
More By This Author:
Deviation Of Instantaneous Inflation From TargetGasoline Prices Thru January 3
Foreign Term Spread Augmented Recession Model Prediction
Disclaimer: This information is presented for informational purposes only and does not constitute an offer to sell, or the solicitation of an offer to buy any investment products. None of the ...
more


