

Image Source: Pexels
July nominal consumption growth at consensus (+0.5%). Month-on-Month annualized real consumption growth at 4.5%, with June revised up from 2.6% to 3.2%. Moreover, annualized personal income ex-transfers grew 1.9% in July. Here is a snapshot of some key indicators followed by the NBER Business Cycle Dating Committee.
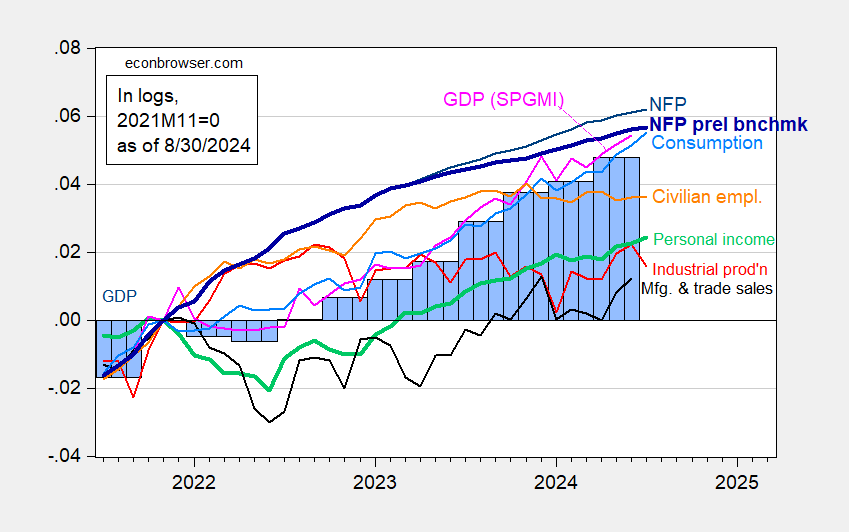
Figure 1: Nonfarm Payroll (NFP) employment from CES (bold blue), implied NFP from preliminary benchmark (bold blue), civilian employment (orange), industrial production (red), personal income excluding current transfers in Ch.2017$ (bold green), manufacturing and trade sales in Ch.2017$ (black), consumption in Ch.2017$ (light blue), and monthly GDP in Ch.2017$ (pink), GDP (blue bars), all log normalized to 2021M11=0. Source: BLS via FRED, Federal Reserve, BEA 2024Q2 2nd release, S&P Global Market Insights (nee Macroeconomic Advisers, IHS Markit) (8/1/2024 release), and author’s calculations.
Here’s a detail of the consumption series, as of latest, and June release.
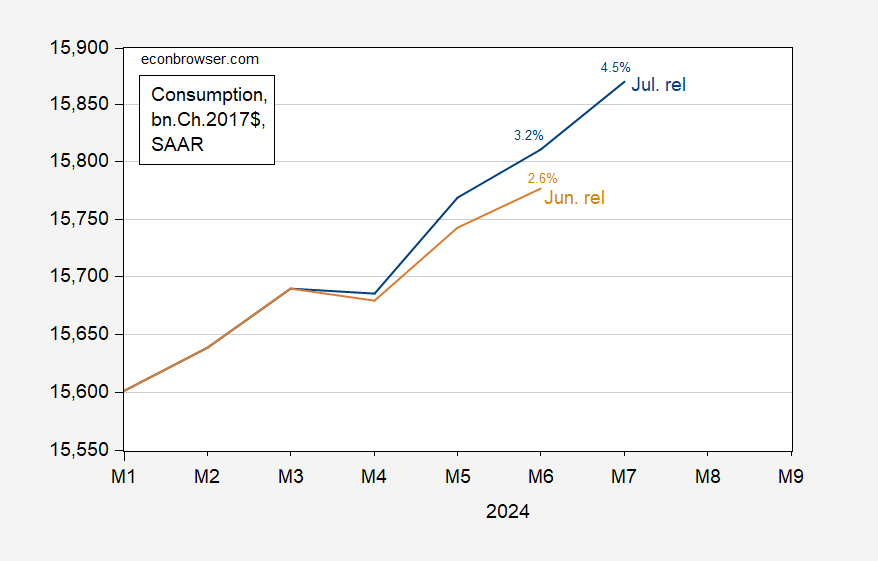
Figure 2: Consumption from July release (blue), from June release (tan), all in bn.Ch.2017$ SAAR. Small % numbers indicate m/m annualized growth rates (log terms). Vertical axis is on a log scale. Source: BEA.
Since the series are plotted on a log scale, the increased slope in July indicates that consumption growth has accelerated. If an incipient recession was in the cards, one would expect — a la the permanent income hypothesis — consumption to moderate (even if only half of consumers were intertemporally optimizing).
GDPNow is 2.5% as of today, up from 2.0% on 8/26. NY Fed’s nowcast is at 2.49% as of today.
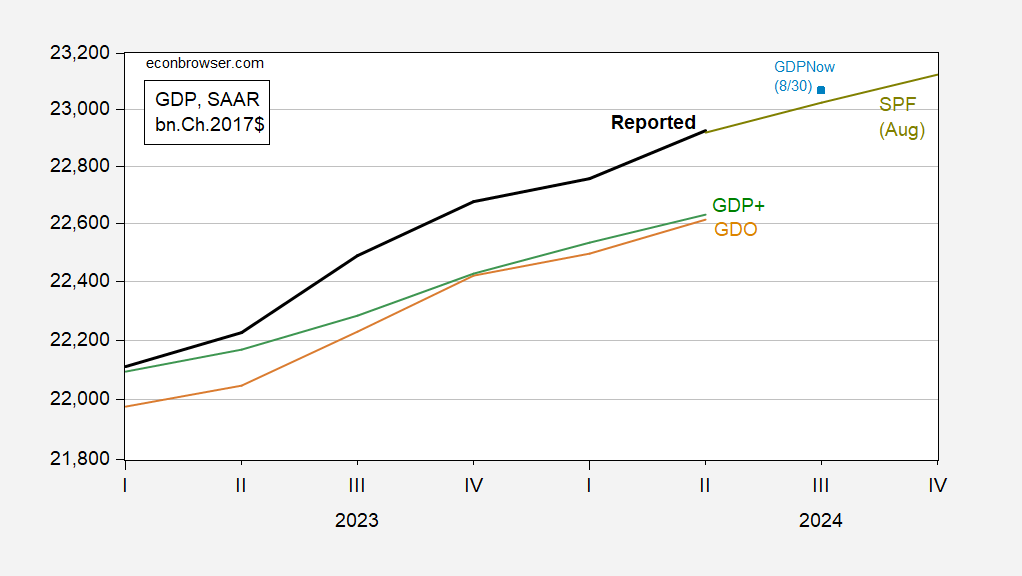
Figure 3: GDP as reported (bold black), GDPNow as of 8/30 (blue square), GDP median forecast from Survey of Professional Forecasters (chartreuse line), GDO (tan), GDP+ (green), all in bn.Ch.2017$ SAAR. GDP+ calculated by iterating GDP+ growth rates on 2019Q4 GDP level. Source: BEA 2024Q2 2nd release, Atlanta Fed, Philadelphia Fed (SPF 8/9), Philadelphia Fed (GDP+ 8/29), and author’s calculations.
The Lewis-Mertens-Stock Weekly Economic Index (for data releases through 8/24) shows growth of 2.27%.
Keeping in mind these data are going to be revised, they in general are not suggestive of an incipient recession, contra here and here.
More By This Author:
We Never Left The Recession Of March 2020 And … Everything Has Been Getting Gradually WorseGDP 2nd Release For Q2
EJ Antoni On The Current Recession


Comments
Log in or sign up to join the conversation.