BTC/USD Forex Signal: Head And Shoulders Point To More Sell-Off
The state of the money supply in the US could worsen as people with student loans start paying back their debt in 2020.
Bearish view
- Sell the BTC/USD pair and set a take-profit at 24,000.
- Add a stop-loss at 26,000.
- Timeline: 1 day.
Bullish view
- Buy the BTC/USD pair and set a take-profit at 26,000.
- Add a stop-loss at 24,000.
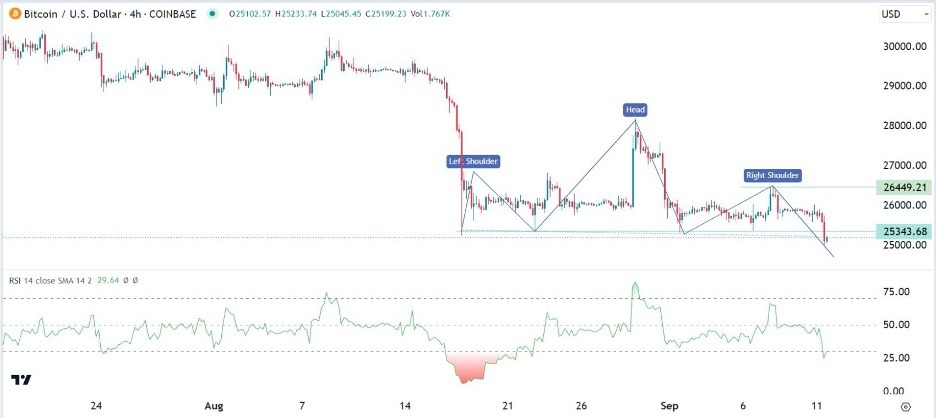
The BTC/USD pair made a strong bearish breakout as demand for cryptocurrencies retreated. Bitcoin dropped to the important support level of $25,000, the lowest level in months.
Money supply concerns
Bitcoin price has been under pressure in the past few months as investors battle several market risks. First, there are regulatory risks in the market as the Securities and Exchange Commission (SEC) case against Coinbase and Binance continues. While these cases will take long to conclude, I believe that they will have significant implications for cryptocurrencies.
Second, there are concerns about the falling money supply in the US and Europe. The most recent data by the Fed shows that the M2 money supply dropped to $20.9 trillion from a peak of over $21.5 trillion. The M2 figure tracks the amount of money available to consumers in form of cash, personal savings, and money market funds.
The money supply has been falling as the Federal Reserve hikes interest rates and continues with its quantitative tightening (QT) policy. The same trend is happening in the European Union, where the bank has been hiking rates for a while.
The state of the money supply in the US could worsen as people with student loans start paying back their debt in 2020. Therefore, there is a likelihood that risky assets like Bitcoin could see more downside in the coming months.
Further, Bitcoin is struggling as investors move to other higher-yielding assets as interest rates rise. Money market fund yields have risen to more than 5%.
The next important economic data that could move the BTC/USD pair will be the upcoming US inflation data scheduled on Wednesday. Economists expect the data to show that inflation remains stubbornly higher than the Fed’s target of 2.0%.
BTC/USD technical analysis
The BTC/USD pair has been in a tight range recently. It made a bearish breakout below the key support at 25,343, the lowest level on September 1 and 6 and in August, The pair moved below the 50-period moving average. Most importantly, it has formed a head and shoulders pattern whose neckline is at 25,343.
The view is that Bitcoin price will likely have a bearish breakout as sellers target the next key support at 24,000. The stop-loss of this trade will be at 26,000.
(Click on image to enlarge)

More By This Author:
AUD/USD Forex Signal: Double Bottom Pattern Forms
GBP/USD Technical Analysis: Downward Trend May Continue
USD/JPY Technical Analysis: Bulls Control The Direction
Disclosure: DailyForex will not be held liable for any loss or damage resulting from reliance on the information contained within this website including market news, analysis, trading signals ...
more


