AUD/USD Forex Signal: Double Bottom Pattern Forms
Bullish view
- Buy the AUD/USD pair and set a take-profit at 0.6522.
- Add a stop-loss at 0.6370.
- Timeline: 1-2 days.
Bearish view
- Sell the AUD/USD pair and set a take-profit at 0.6360.
- Add a stop-loss at 0.6520.
The AUD/USD exchange rate drifted upwards on Monday as the recent US dollar sell-off took a breather. The pair rose to a high of 0.6455, the highest point since September 5th as investors waited for the upcoming US inflation numbers.
US dollar rally eases
The AUD/USD pair bounced back as the US dollar index (DXY) retreated. The index dropped by more than 60 basis points. This decline happened as several Federal Reserve officials hinted that they would support pausing rate hikes in the September meeting.
Lorie Logan, the head of Atlanta Fed, and Christopher Waller, a member of the bank’s board of governors, said that they supported pausing in next week’s meeting. These views are supported by minutes of the last meeting, which showed that some members were concerned about the impact of more tightening.
Therefore, the pair will react to the upcoming US inflation and retail sales numbers. Economists polled by Reuters expect the data to show that the country’s headline inflation rose again from 0.2% in July to 0.6% in August. This will translate to a year-on-year increase of 3.4%. If analysts are accurate, it will be the second straight month that inflation rose.
Core inflation, on the other hand, is expected to remain unchanged at 0.2% on a MoM basis. On a YoY basis, inflation is expected to retreat from 4.7% to 4.3%. The main reason why inflation is expected to remain at an elevated level is that consumer spending remains high and gasoline prices have jumped. The average gasoline price has jumped to $3.82 as Brent rose to $90.
Therefore, analysts expect that the Federal Reserve will pause in September and then deliver another hike later this year. In contrast, the Reserve Bank of Australia (RBA) is expected to maintain rates unchanged throughout the year.
AUD/USD technical analysis
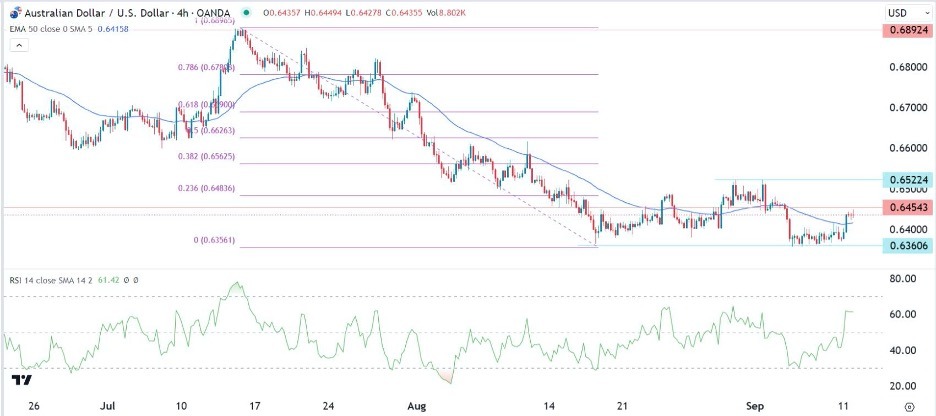
The AUD/USD pair dropped to a low of 0.6360 last week. This was an important support level since it was the lowest level on August 17th. It has formed a double-bottom pattern whose neckline is at 0.6522 (1st September high). The pair has moved above the 50-period moving average while the Relative Strength Index (RSI) has moved to 60.
Therefore, because of the double-bottom pattern, the pair will likely continue rising as buyers target the neckline at 0.6522. This view will be confirmed if it moves above the key resistance at 0.6455 (May 31st low).
(Click on image to enlarge)

More By This Author:
GBP/USD Technical Analysis: Downward Trend May ContinueUSD/JPY Technical Analysis: Bulls Control The Direction
BTC/USD Forex Signal: Bitcoin Remains In A Deep Slumber
Disclosure: DailyForex will not be held liable for any loss or damage resulting from reliance on the information contained within this website including market news, analysis, trading signals ...
more


