
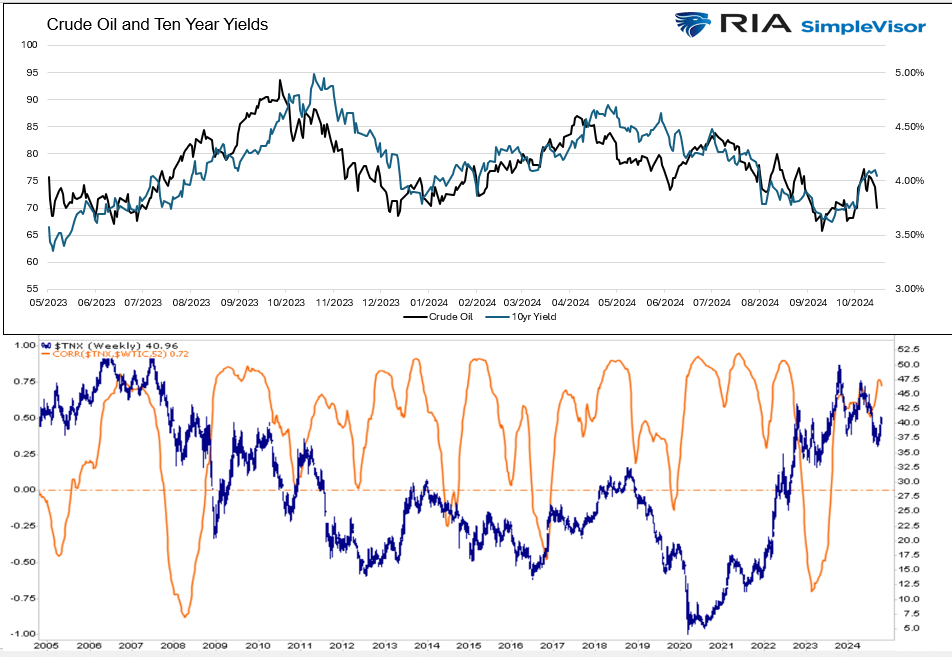
It’s no secret that bond yields are heavily impacted by inflation and inflation expectations. Moreover, oil prices have a high correlation with inflation. So, to answer why bond yields are rising recently, it’s helpful to check the oil price. Since May 2023, as we share below, crude oil prices and ten-year UST yields have been tracking each other closely. But, you will see that oil tends to lead bond yields when the trends change. The lower graph shows the running 1-year correlation of oil and bond yields on a long-term basis. While there is a long-term positive relationship, it does vary significantly over time.
Crude has fallen rapidly in the last week as it appears Israel will not target Iranian oil facilities. With the relatively sharp decline lower, oil is again approaching significant support at $67 a barrel. A break below $67 could lead oil toward $60 or lower. Thus far, yields haven’t followed the decline. Is the highly tight correlation breaking? Or are bond yields waiting a couple of weeks, as they have in the past, before following crude oil prices lower?
(Click on image to enlarge)
What To Watch Today
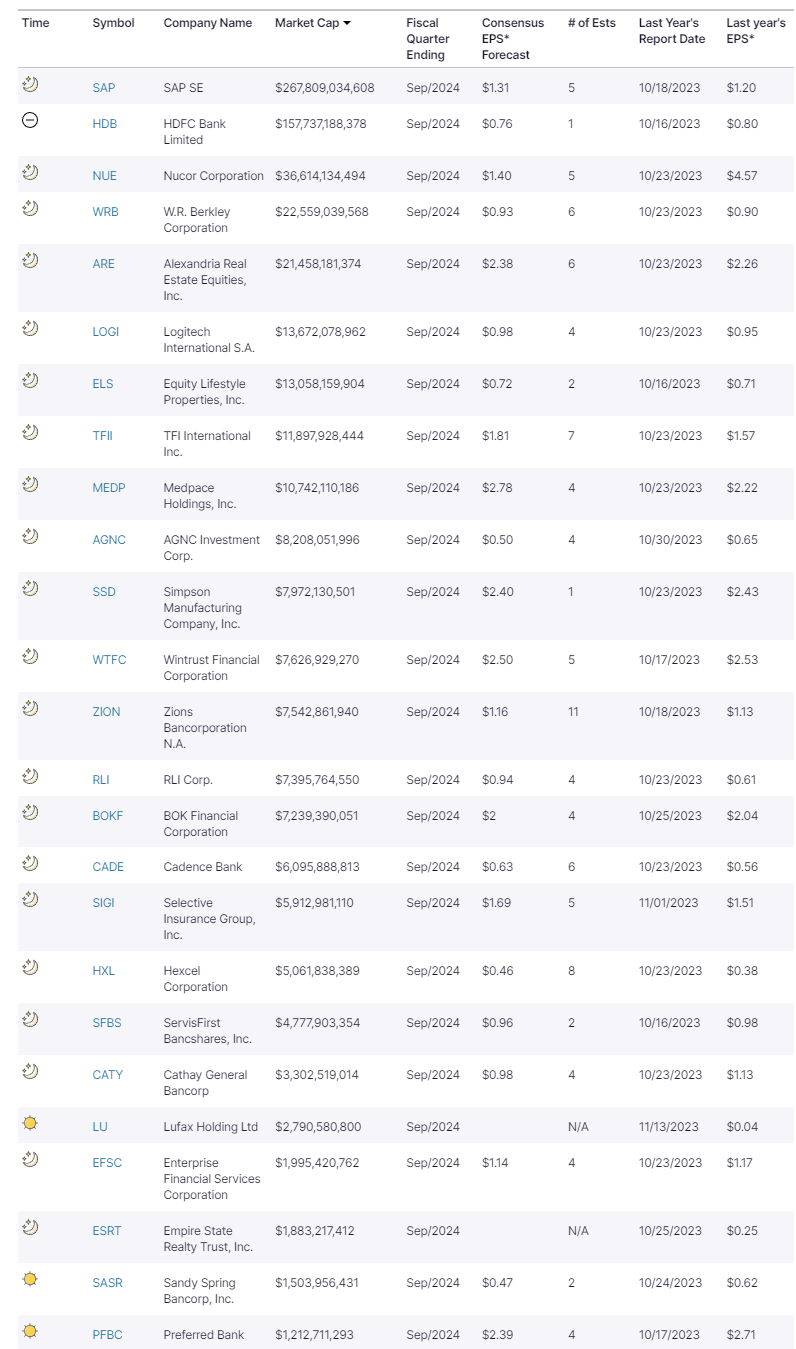
Earnings
(Click on image to enlarge)
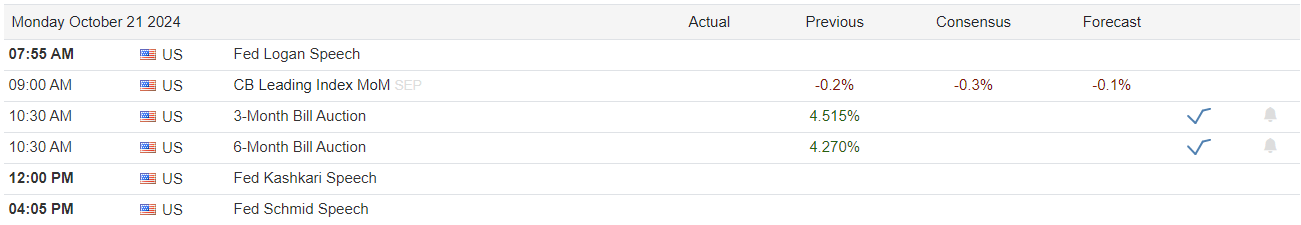
Economy
(Click on image to enlarge)
Market Trading Update
Last week, we discussed the triggering of the seasonal MACD buy signal. To wit:
“On Friday, the market broke out to the upside of that wedge pattern, triggering a “seasonal MACD buy” signal. Notably, that buy signal also marks the beginning of the seasonally strong 6 months of the year. The series of high lows, now combined with higher highs, remains a significant bullish backdrop for investors. With earnings season starting in earnest this coming week, the bias remains to the upside, but risk management protocols should not be abandoned.”
The chart below is the WEEKLY S&P 500 chart, with three different signals to confirm the start of the seasonal period. With Friday’s close in the green, keeping the week broadly positive, all three seasonal buy signals have been triggered.
(Click on image to enlarge)

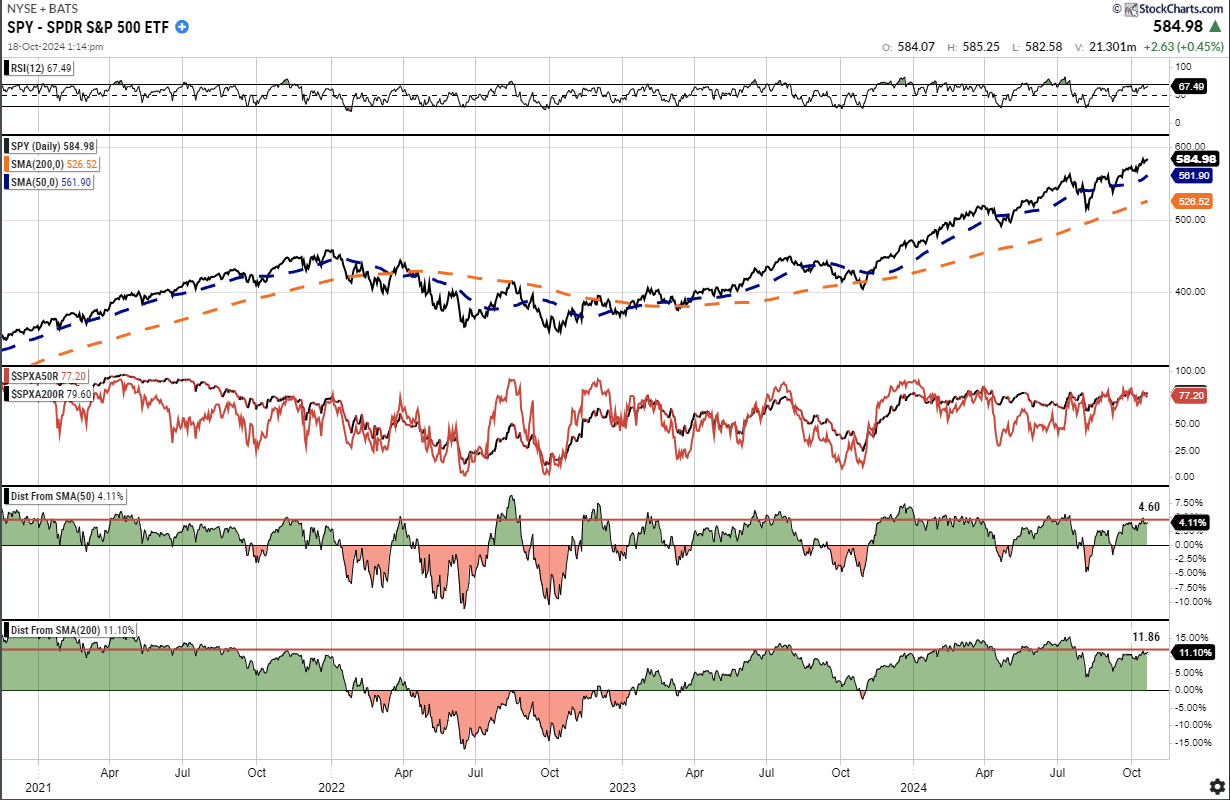
However, as noted last week, just because the seasonally strong period of the year has technically started, it doesn’t mean that the markets won’t have corrections along the way. Notably, we have already had 6-straight weeks of gains, which is a long stretch without a pullback. Secondly, while the market is on a weekly “buy signal,” the market is both deviated and overbought short-term. When the market breadth is very elevated, combined with overbought and deviated markets from the 50 and 200-DMA, corrections and consolidations tend to be more prevalent.
(Click on image to enlarge)
We expect that the market will experience a short-term consolidation or correction. However, there are three reasons why such will likely provide a better entry point to add exposure.
- The current bullish trend remains intact, and bullish sentiment is very strong. This has led to significant and continuing inflows into the market, which will support asset prices.
- Corporate buybacks will resume at the end of the month and will amount to roughly $6 billion per day into year-end.
- Many managers lag in the market and must play catch-up by year-end for reporting purposes.
These three reasons will likely push asset prices to our target of 6000 on the index by year-end. However, do not get too complacent, as 2025 will be a year of increased volatility.
The Week Ahead
Corporate earnings will make the headlines this week, as there is little economic data. Many large and small companies report, including Google on Tuesday, Tesla on Wednesday, and Amazon on Thursday. As we wrote in this past weekend’s Newsletter, earnings expectations have come down significantly over the last month. Accordingly, the odds are that most companies beat expectations. However, forward guidance often plays a more significant role than actual earnings and revenues regarding the stock’s immediate performance.
Bastiat And The Broken Window
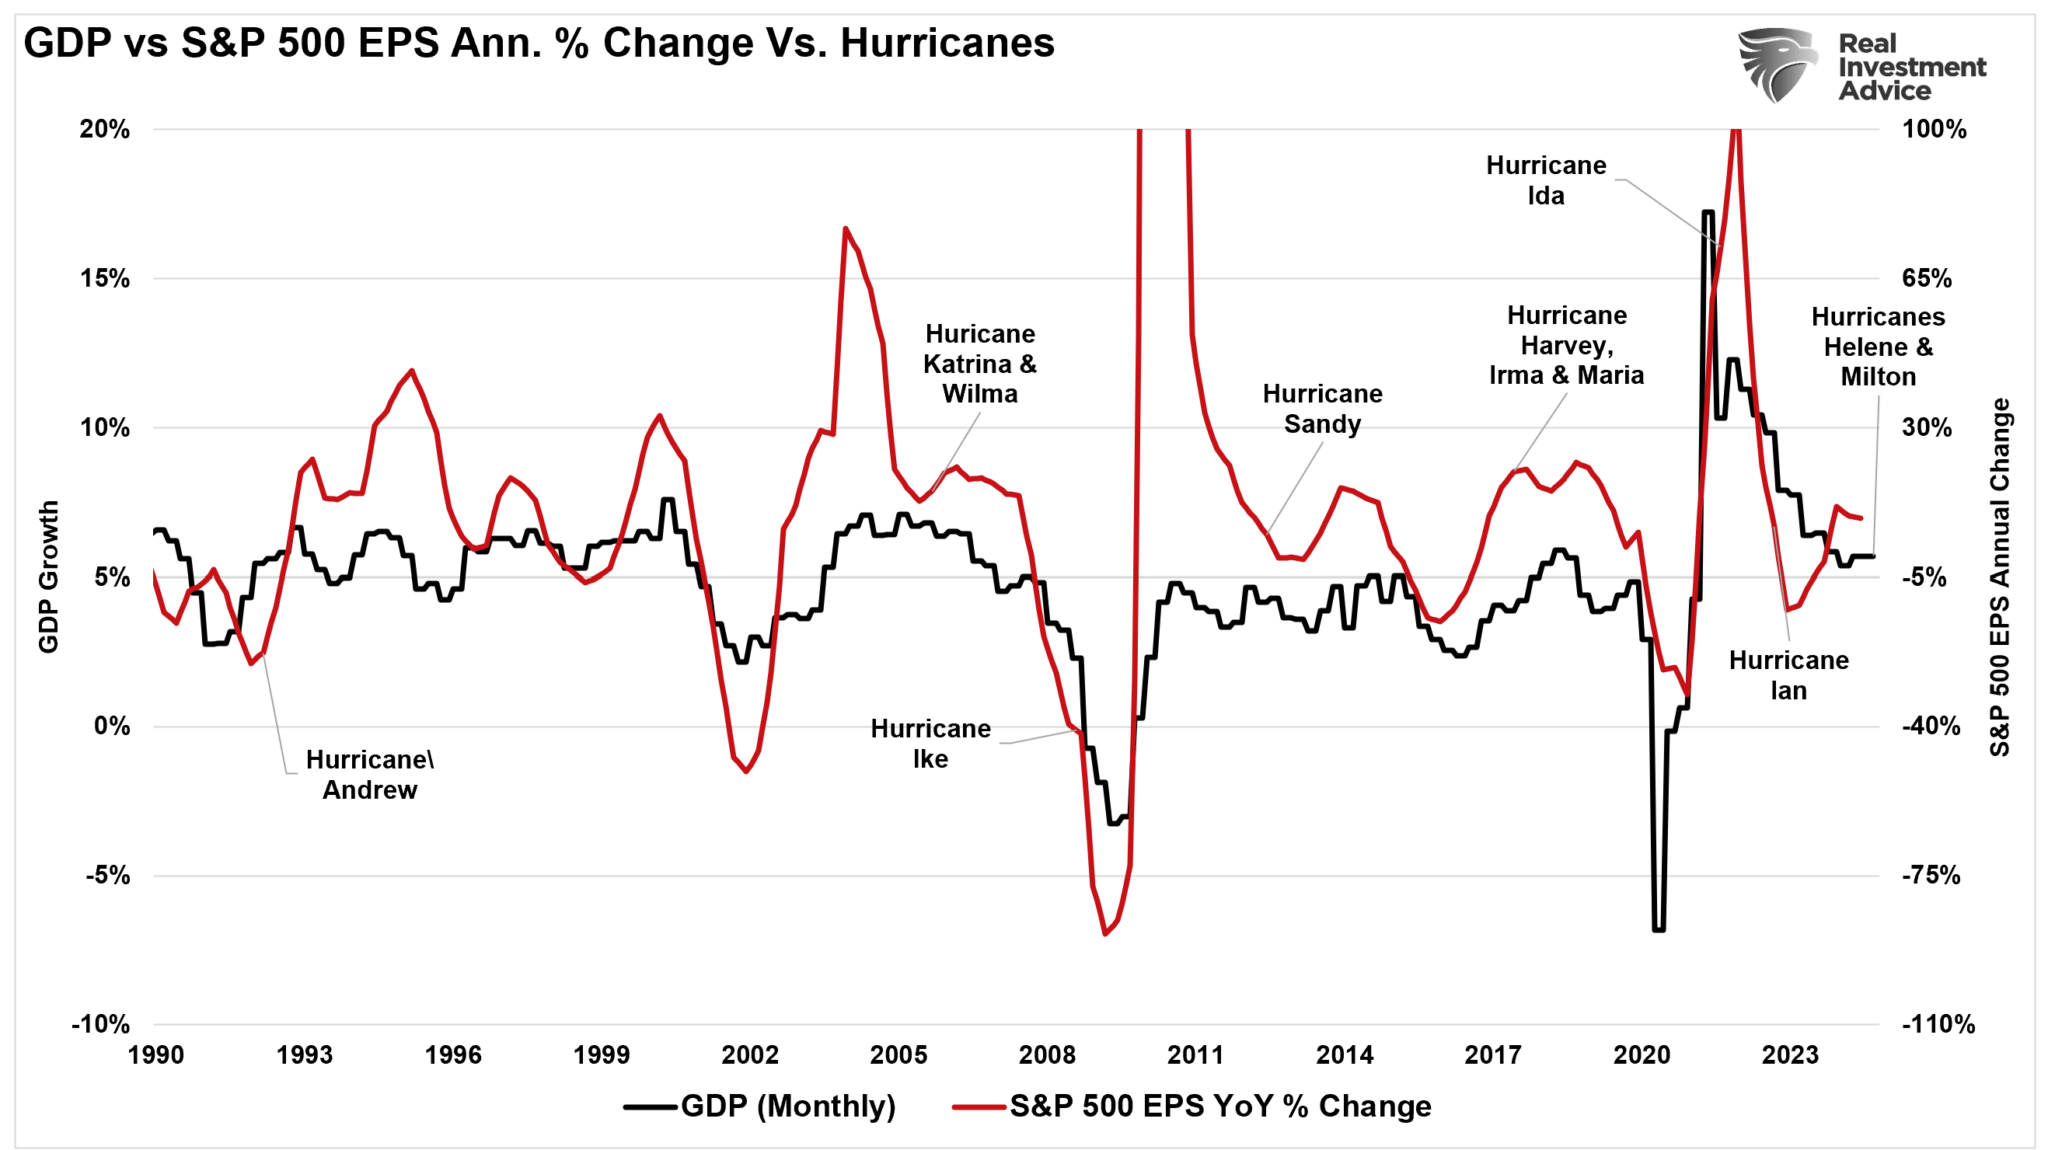
Recent events, particularly the devastation caused by Hurricanes Helene and Milton in 2024, provide a clear example of why destruction does not create long-term economic prosperity. Despite the short-term boost in economic activity from rebuilding efforts, the broader economic implications are far more detrimental. In this post, we will delve into Bastiat’s Broken Window Theory, apply it to the aftermath of the hurricanes, and explain why destruction and the need to replace lost goods drag forward future consumption rather than create new economic value.
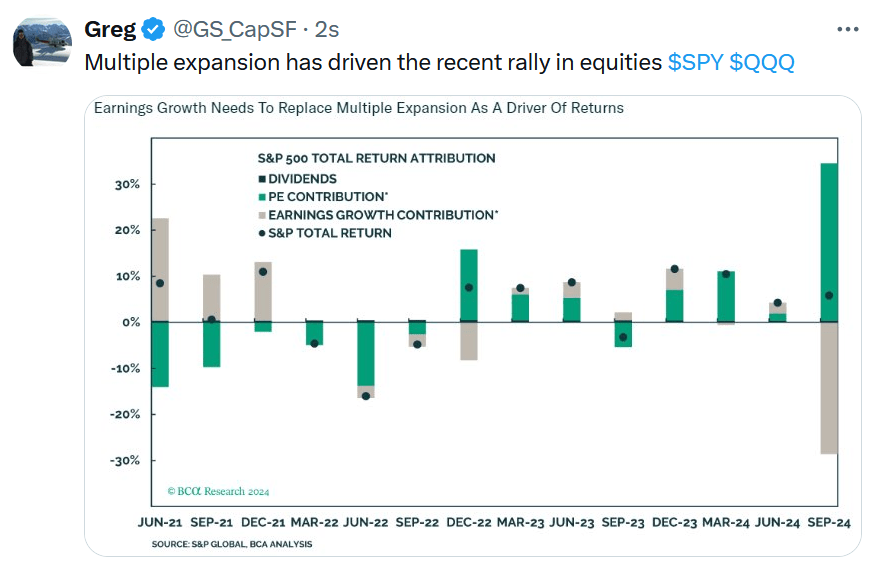
Tweet of the Day
More By This Author:
Q3-Earnings Estimates Remain Overly Optimistic
Taiwan Semiconductor Nullifies ASML Fears
Bastiat And The “Broken Window”


Comments
Log in or sign up to join the conversation.