
Who's Buying What: Latest CoT Report
Following futures positions of non-commercials are as of March 8, 2022.
10-year note: Currently net short 377.7k, up 11.9k.
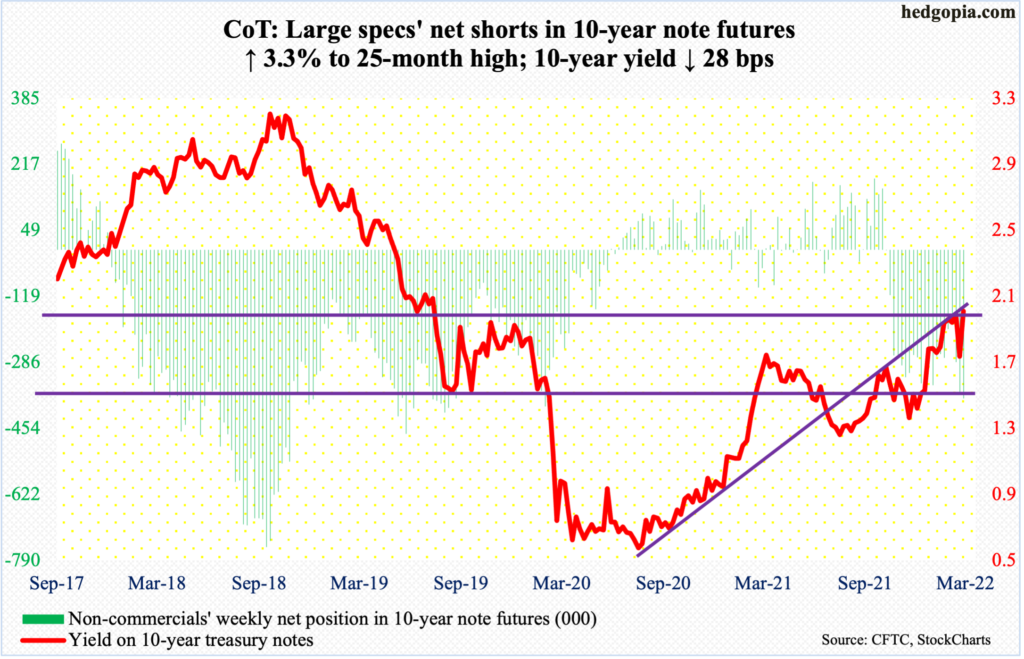
Next Tuesday, a two-day FOMC meeting begins. This is the year’s second; six more remain after this. Ahead of this, fed funds futures have priced in a 25-basis-point increase. Speaking to Congress recently, Jerome Powell, Federal Reserve chair, suggested as much, saying he expects a quarter-point hike.
Next week’s meeting comes with a summary of economic projections. It will be interesting how they will revise the GDP and inflation forecasts. In the December meeting, they expected headline and core PCE inflation this year to come in at 2.6 percent and 2.7 percent respectively, revised upward from September’s 2.2 percent and 2.3 percent. The year is young, but inflation is coming in much hotter than expected. In the 12 months to January, headline and core PCE grew 6.1 percent and 5.2 percent, which is the highest since February 1982 and April 1983, in that order.
The Fed is cornered. Inflation is running rampant (more on this here), and they need to act. Concurrently, the yield curve has begun to narrow, with the spread between 10- and two-year treasury yields 25 basis points. No inversion yet – hence risks of a recession – but it is not headed the right direction. A year ago, the spread peaked at 159 basis points, before trending lower, with the most recent peak in early January at 89 basis points.
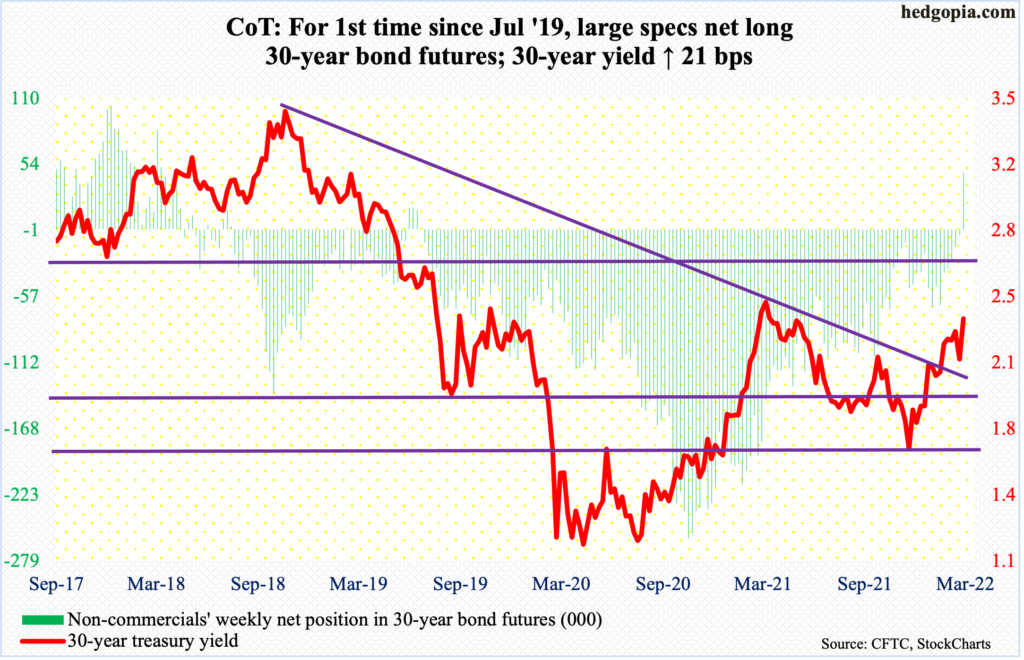
30-year bond: Currently net long 47.4k, up 51.9k.
Major economic releases for next week are as follows.
On Tuesday, the producer price index (February) and Treasury International Capital data (January) are on deck.
Wholesale prices increased one percent month-over-month in January and 9.7 percent in the 12 months to January. Over the same period, headline and core PPI respectively grew 0.9 percent and 6.9 percent.
In the 12 months to December, foreigners purchased $46.7 billion in US stocks, which is on a declining trend, having peaked at $405.5 billion last March.
Retail sales (February) and the NAHB housing market index (March) will be published on Wednesday.
Sales jumped 13 percent y/y to $649.8 billion (SAAR) in January – a new record. Post-pandemic, sales languished, and bottomed, at $409.8 billion in April 2020.
Homebuilder optimism fell a point m/m to 82 in February – a four-month low. The all-time high of 90 was posted in November 2020, which was three times the post-pandemic low of 30 from April that year.
Housing starts (February) and industrial production (February) are due out Thursday.
Starts declined 4.1 percent m/m in January to 1.64 million units (SAAR) – a three-month low.
US capacity utilization increased 3.5 percent year-over-year to 77.6 percent – a 34-month high.
Friday brings existing home sales (February). January sales were up 6.7 percent m/m to 6.5 million units (SAAR) – a one-year high.
WTI crude oil: Currently net long 350.8k, down 16.9k.
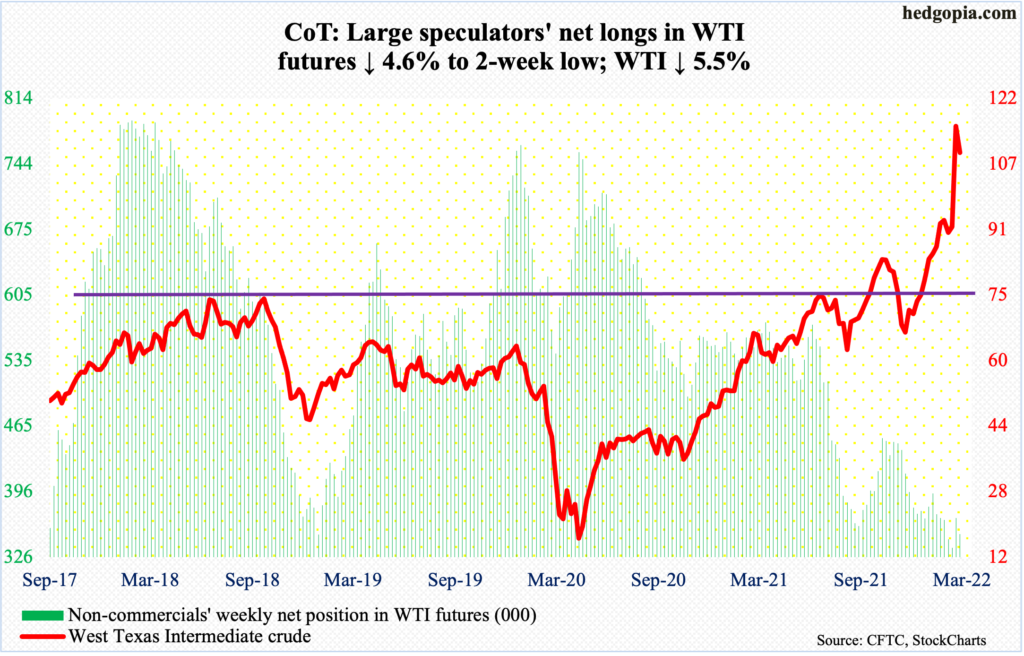
March is nearly halfway through, and the month has so far produced a candle with a very long upper wick. On Monday, the West Texas Intermediate crude ($109.33/barrel) touched $130.50, which was the highest price since July 2008 when it peaked at an all-time high of $147.27.
Monday’s rally came on the back of US ban of Russian oil. However, Germany was unwilling to go along. There was also talk of replacing Russian oil from Venezuela and Saudi Arabia. But the fact remains that replacing the seven million barrels that Russia exports is physically impossible.
Either way, WTI probably fell under its own weight, as it more than doubled in three months; early December, the crude bottomed at $62.43. Ukraine tensions have not subsided, but at some point the urge to lock in massive gains wins out.
Should $105-$106 get breached, there is support at $95, and $85 after that.
In the meantime, for the fifth straight week through the 4th, US crude production remained unchanged at 11.6 million barrels per day. Crude imports rose 652,000 b/d to 6.3 mb/d. Stocks of crude, gasoline and distillates, however, all fell – down 1.9 million barrels, 1.4 million barrels and 5.2 million barrels respectively to 411.6 million barrels, 244.6 million barrels and 113.9 million barrels. Refinery utilization increased 1.6 percentage points to 89.3 percent.
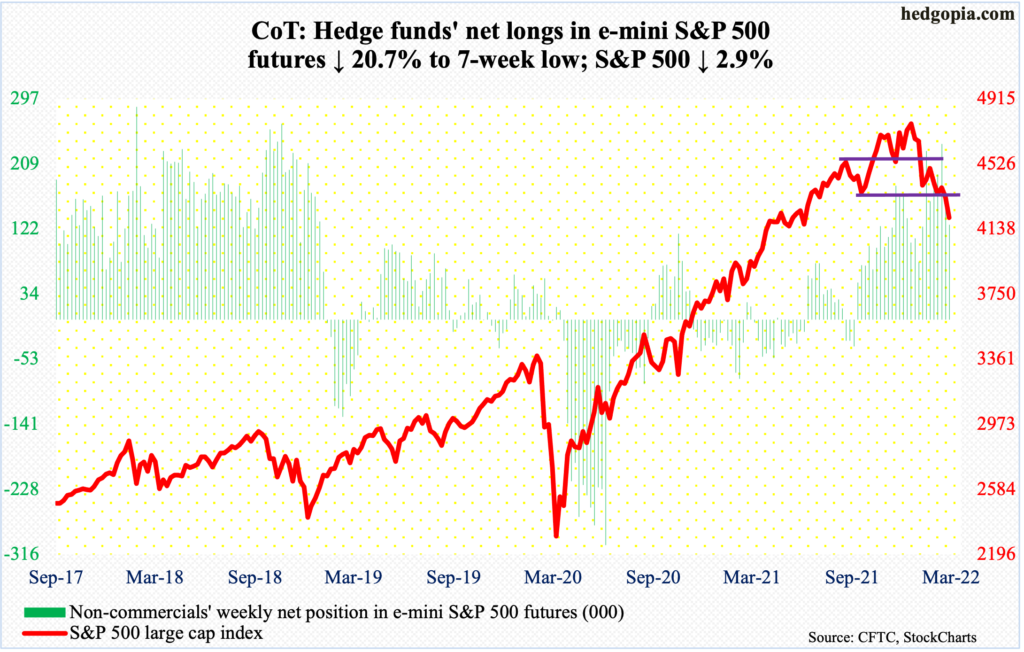
E-mini S&P 500: Currently net long 127.7k, down 33.4k.
In the week to Wednesday, US-based equity funds took in $12.5 billion (courtesy of Lipper). This was the fifth straight week of inflows, having attracted $22.8 billion in the prior four. Throughout this, the S&P 500 came under downward pressure.
On February 24, the large cap index (4204) put in a lower low of 4115 – versus 4223 on January 24 – dropping 14.6 percent from the January 4 record high. This week, bulls denied bears a lower low, as selling stopped at 4158 on Tuesday (more on this here).
Reclaiming of 4280s, which is where the 10-day moving average lies – and after that the 20-day – will give bulls some momentum in the near term. A rising trend line from last month’s low gets tested at 4180s. This needs to hold – and most importantly the February 24 low.
Medium- to long-term, several metrics remain on the elevated side. Thursday’s Z.1 report for 4Q21 showed US households’ equity allocation ended 2021 at 38.1 percent – a record (chart here).
Euro: Currently net long 58.8k, down 6.1k.
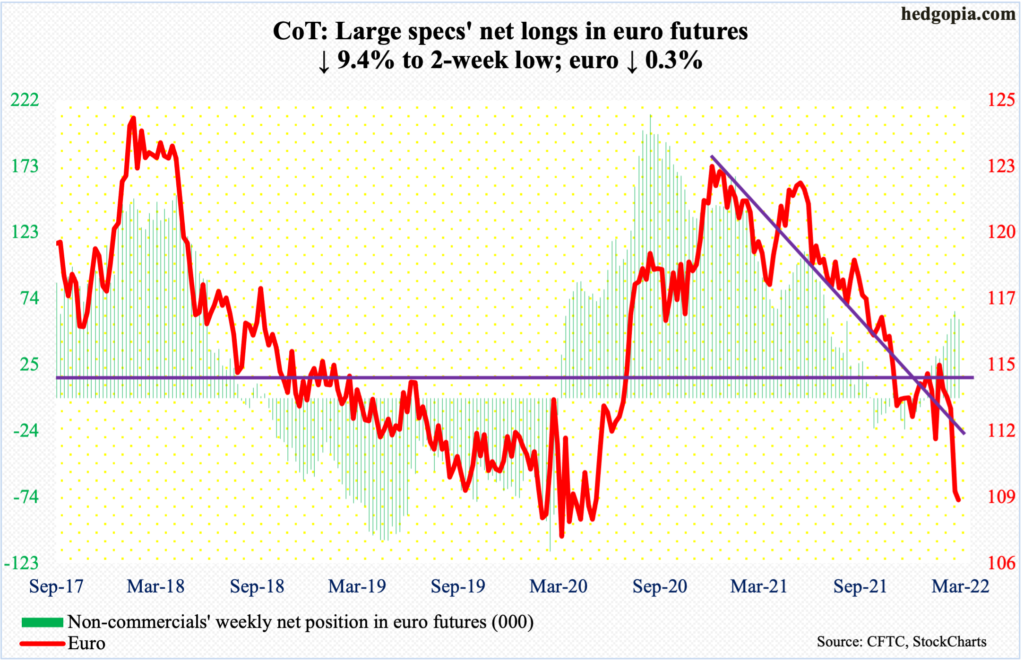
The week began with continued downward momentum but selling stopped after touching $108.45 on Monday. The euro ($109) has been in a downtrend trend since peaking at $1.2345 last January and has broken one after another support zones since.
On Thursday, the ECB met and announced some important changes, including a faster unwinding of its asset purchase program, which will be phased out in 3Q. The central bank revised its 2022 inflation forecast from 3.2 percent three months ago to 5.1 percent, hinting an interest rate hike before the year was over. This helped the euro, but only briefly. In the end, the currency dropped 0.8 percent in that session and 0.3 percent for the week.
When it is all said and done, the ECB remains dovish – relative to the Federal Reserve and the Bank of England in particular. The Ukraine situation will for sure adversely impact European growth. As things stand, the rate differential is likely to favor the dollar.
Gold: Currently net long 274.4k, up 16.8k.
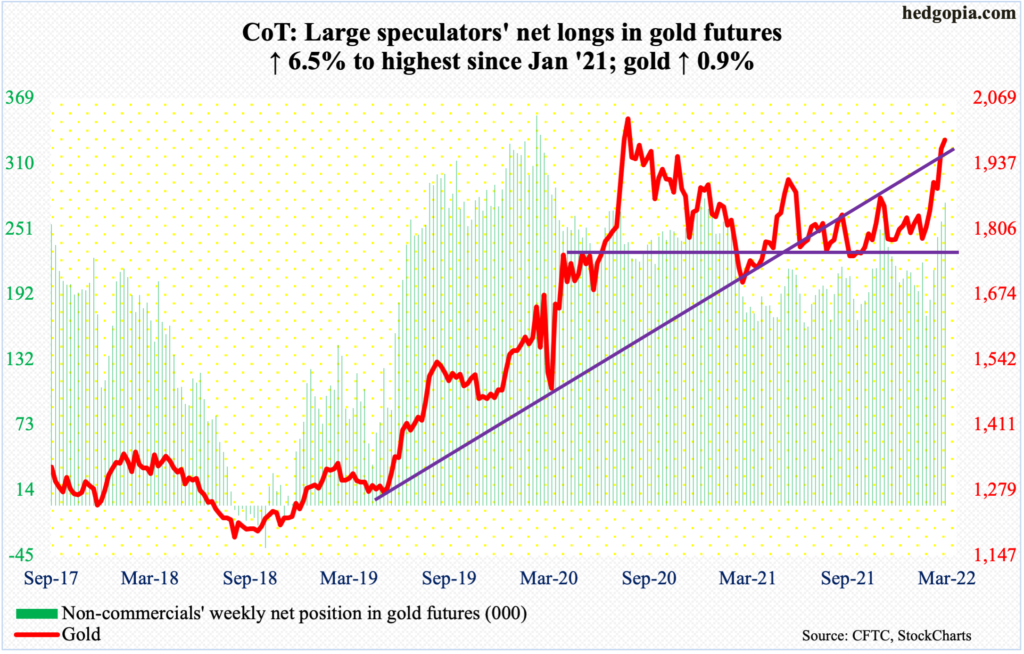
On Tuesday, gold ($1,985/ounce) was less than $11 from posting a new record high.
In September 2011, the metal retreated after touching $1,924. It did not bottom until December 2015 when it tagged $1,045. The September 2011 high was surpassed in July 2020, followed by a new high $2,089 in August that year. This week, gold rallied to $2,079 before attracting sellers.
A breakout – should one occur – will be massive and will have come after formation of a nice base. Until that happens, unwinding of the overbought condition the metal is in is the path of least resistance. There is decent support at $1,970s, followed by crucial breakout retest at $1,920s.
Nasdaq 100 index (mini): Currently net long 26.6k, up 14.5k.
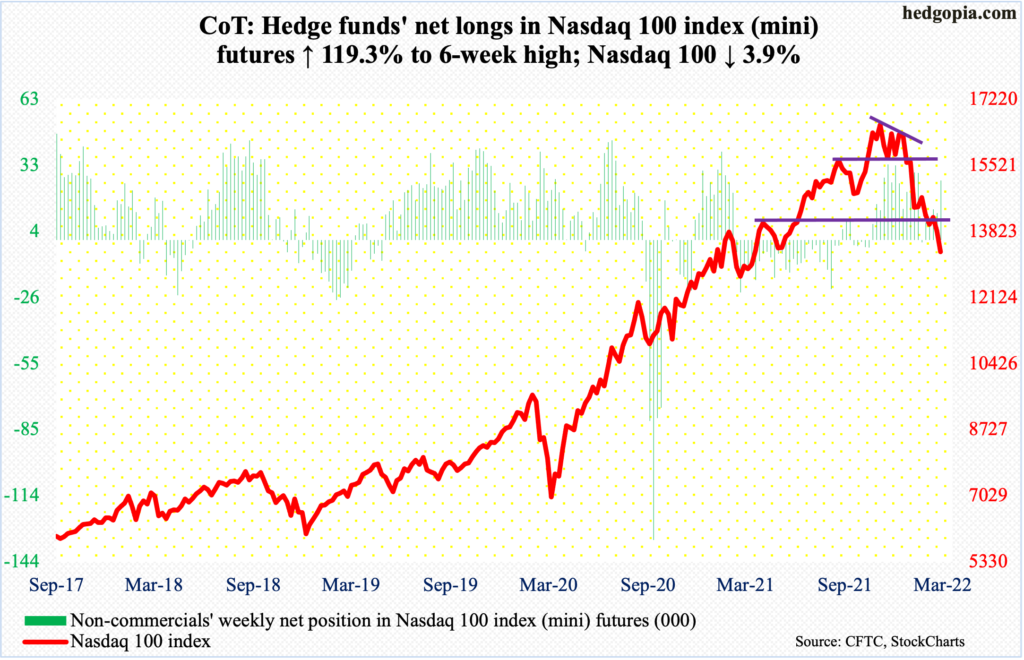
On Tuesday, the Nasdaq 100 came close to notching a lower low but was saved on time – 13129 versus the February 24 low of 13065.
The index (13302) dropped 22.1 percent between the November 2021 high (16765) and the February 24 low. During the decline, several support zones were breached. This requires time to repair.
This week, tech bulls did their best to put their foot down but ended down 3.9 percent anyway. This was the fourth down week in the last five. For consolation, they were spared from a lower low. Should the index manage to at least go sideways in the next several sessions, shorter-term averages, which are still dropping, will begin to behave.
Russell 2000 mini-index: Currently net short 25.5k, down 4.1k.
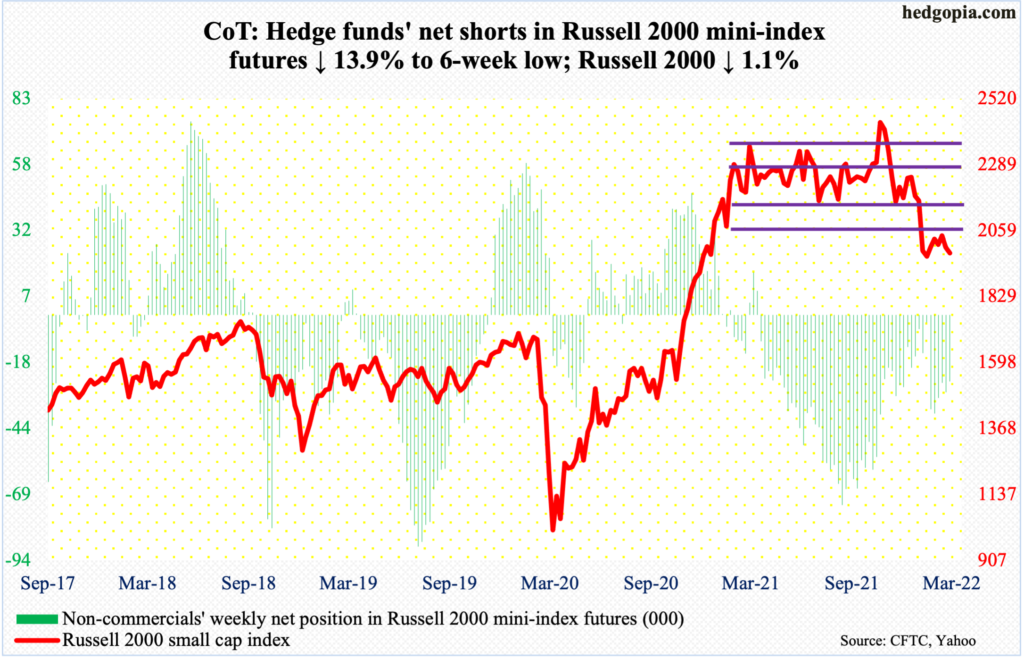
Small-caps held up better this week, down 1.1 percent. Their larger-cap cousins fared worse, with the S&P 500 down 2.9 percent and the Nasdaq 100 down 3.9 percent.
This follows a 23-percent tumble from the November 2021 high of 2459 through the February 24 low of 1895. That low essentially was a successful test of the prior low of 1901 from January 28. This week, the Russell 2000 (1980) twice held low-1950s.
Bulls would have significantly improved their odds once they recapture 2080s, which is where a declining trend line from last November lies. This level is also a backtest of a broken rectangle.
From March last year through last month, the Russell 2000 was rangebound between 2350s and 2080s, and between 2280s and 2150s within this rectangle. On Nov 3, it broke out but was quickly followed by a failed retest on the 19th (November), followed by a range breakdown in January.
US Dollar Index: Currently net long 34k, down 730.
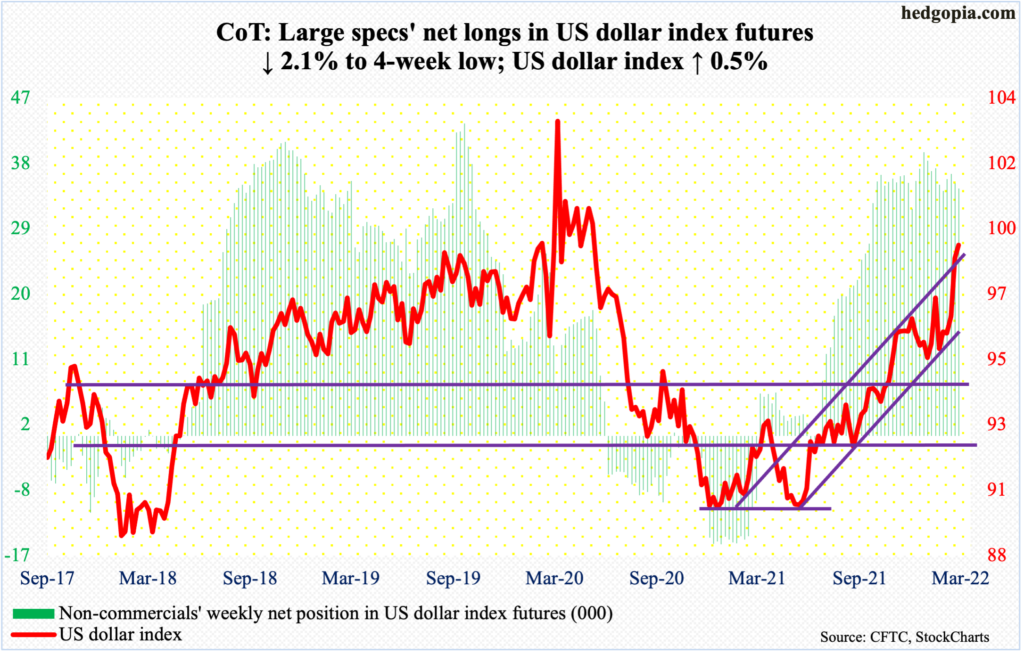
The US dollar index decidedly broke out of 97 last week. This week, it built on that further, tagging 99.43 on Monday, which was the highest print since May 2020. Resistance at the 100 level goes back years.
After Monday’s 22-month high, weakness followed. The index (99.13) has trended higher since last May when it bottomed at 89.51. At Monday’s high, the US dollar index would have comfortably broken out of a rising channel from that low.
Odds favor this channel holds for now.
VIX: Currently net short 50.4k, down 4.4k.
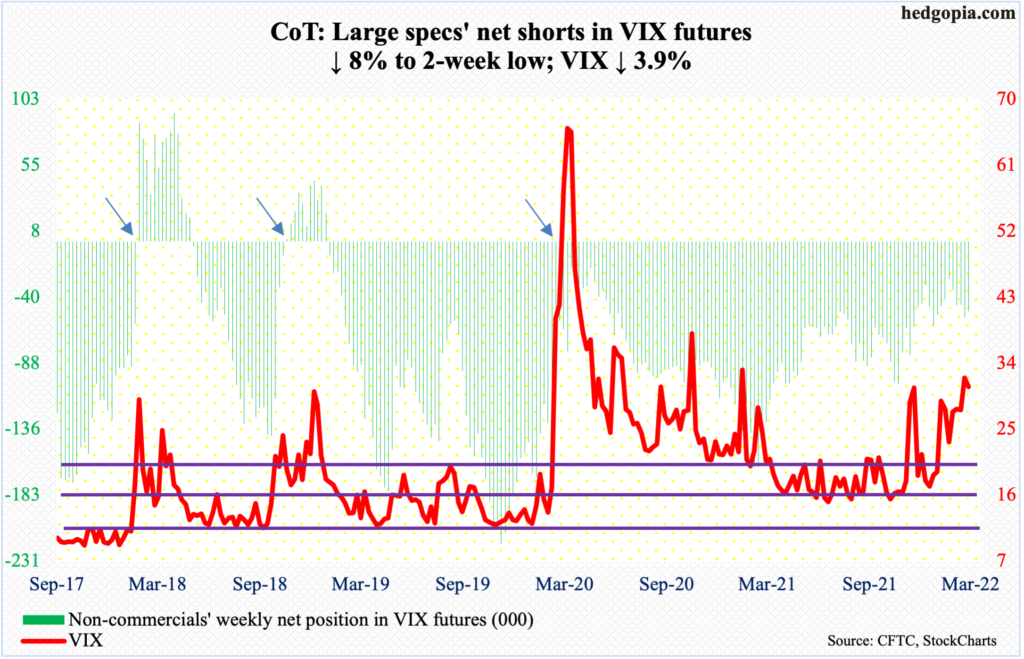
Tuesday’s high of 37.52 represents a lower high versus 37.79 from February 24 and 38.94 from January 24. Below, VIX has trended higher since last November’s 14.73. Consequently, a pennant is forming. Should the pattern resolve to the upside, VIX could be headed a lot higher.
For now, the daily seems to want to go lower. Once again, the volatility index (30.75) was unable to sustain above 32, which has been the case since early December (last year).
This week, VIX gave back 3.9 percent – a rare occurrence as it moved in unison with the S&P 500.
There is support at mid-20s, and low-20s after that.


