
Following futures positions of non-commercials are as of October 4, 2022.
10-year note: Currently net short 366.9k, up 1.7k.
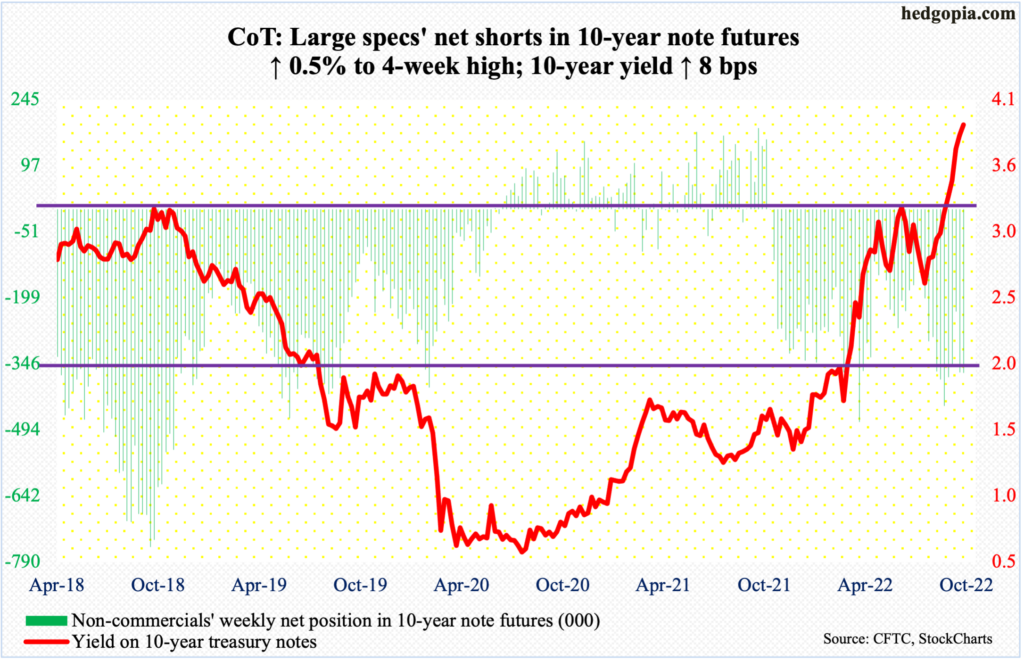
Wednesday brings FOMC minutes for the September 20-21 meeting. The fed funds rate was raised by 75 basis points in that meeting, to a range of 300 basis points to 325 basis points, and Chair Jerome Powell signaled more aggressive hikes ahead. After that meeting, FOMC members – both voting and non-voting – have continued to sound hawkish, citing elevated inflation. Given this, the minutes are unlikely to contain a softer message.
In the futures market, traders continue to expect another 75 in November and a 50 in December, ending the year between 425 basis points and 450 basis points. Friday’s jobs report for September was stronger than expected, even though the economy produced 263,000 non-farm jobs, which further pulled down the monthly average this year to 420,000, down from last year’s average of 562,000.
Amidst this comes a smaller-than-expected, 25-basis-point raise by the Reserve Bank of Australia. Earlier, the Bank of England had to step in to calm a nervous market by purchasing long-term government bonds. This has – again – created hopes of dovish central bank pivots.
There are some incipient signs of improving pricing pressure (more on this here). At this point in the cycle, a pivot does not necessarily have to mean the Fed does a U-turn and starts lowering the benchmark rates. Or, it does not necessarily have to stop hiking, but just hike by a smaller than previously telegraphed. Alternatively, it can achieve the effects of continued tightening by also leaving the rates flattish between, say, four percent and 4.5 percent longer.
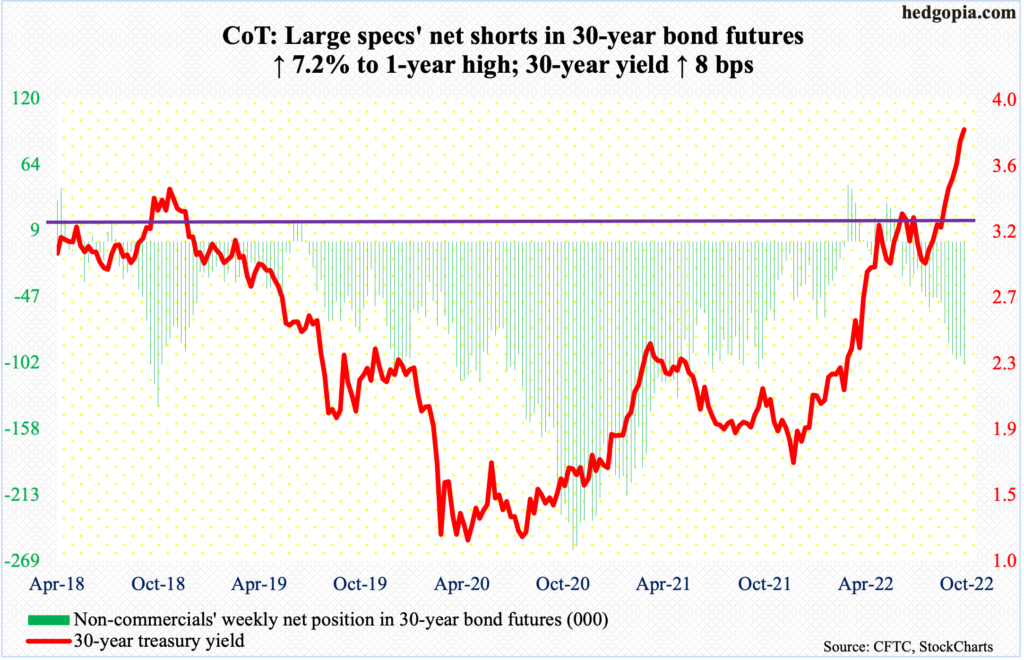
30-year bond: Currently net short 103.5k, up 7k.
Major economic releases for next week are as follows.
The NFIB optimism index (September) is due out on Tuesday. Small-business optimism rose 1.9 points month-over-month in August to 91.8 – a three-week high.
On Wednesday, the producer price index (September) is scheduled. Wholesale prices in August increased 8.7 percent year-over-year.
Thursday brings the consumer price index (September). In the 12 months to August, headline CPI increased 8.3 percent. This follows an increase of 8.5 percent in July and 9.1 percent in June, with the latter highest since November 1981.
Retail sales (September) and the University of Michigan’s consumer sentiment index (October) are on tap for Friday.
August retail sales were up 0.3 percent m/m to a seasonally adjusted annual rate of $683.3 billion, just slightly off the record high $684.1 billion set in June.
In September, consumer sentiment inched up four-tenths of a point m/m to 58.6 – a five-month high.
WTI crude oil: Currently net long 253.7k, up 8.2k.
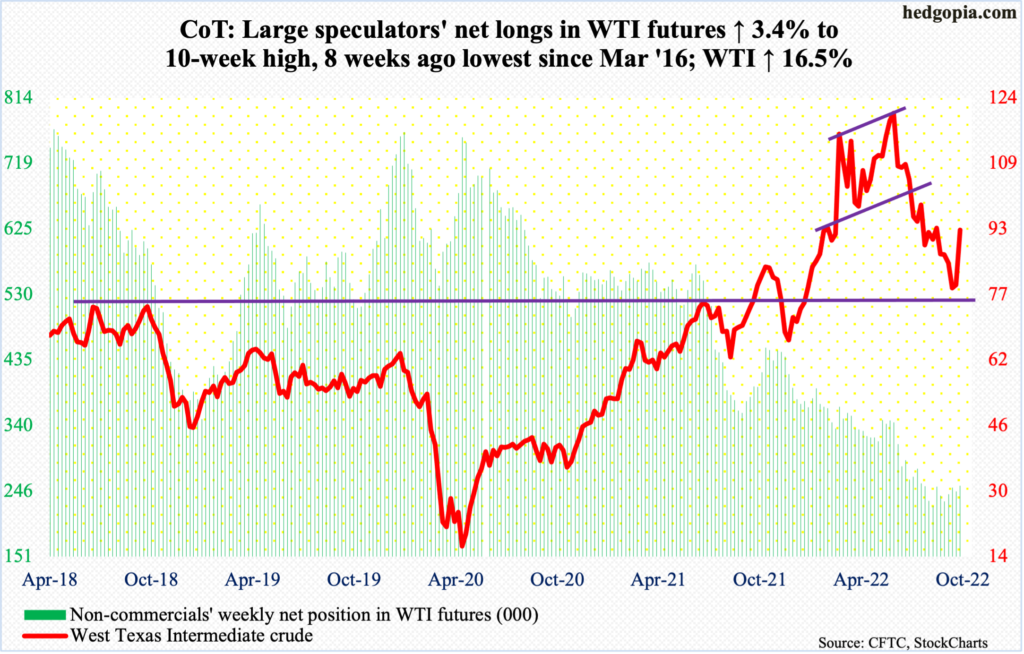
WTI shot up 16.5 percent this week to $92.64/barrel. This follows last week’s weekly spinning top after four down weeks in a row.
The crude rallied in all five sessions this week. Fundamentally, sentiment was particularly buoyed by the news on Wednesday that the OPEC+ had agreed to an output cut of two million barrels per day. Real cuts could be well under that because of under-production, but the cut was larger than what the market was expecting.
Earlier, WTI last week tagged $76.25, just about testing $75, or thereabouts, which has been an important price point going back to April 2006.
With this week’s move, the daily is now extended, but the crude can continue to rally in the right circumstances on the weekly.
In the meantime, per the EIA, US crude production in the week to September 30 was unchanged at 12 mb/d. Crude imports, on the other hand, decreased 502,000 b/d to 5.9 mb/d. As did stocks of crude, gasoline, and distillates, which respectively fell 1.4 million barrels, 4.7 million barrels and 3.4 million barrels to 429.2 million barrels, 207.5 million barrels and 110.9 million barrels. Refinery utilization increased seven-tenths of a percentage point to 91.3 percent.
E-mini S&P 500: Currently net short 209.3k, up 59.1k.
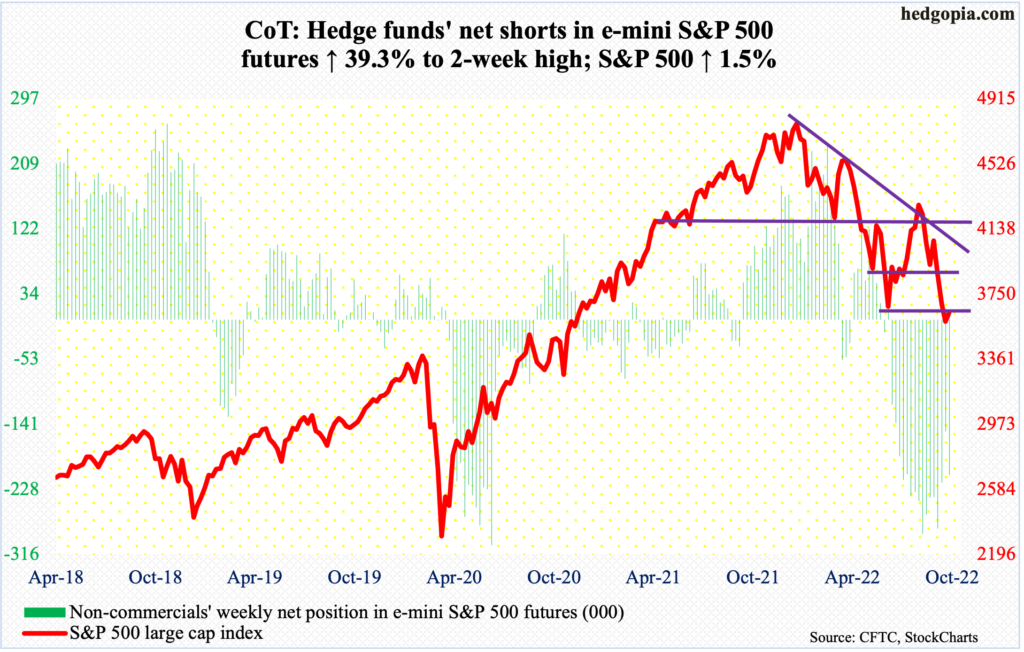
In the week to Wednesday, another $4.5 billion left US equity funds (courtesy of Lipper). This was the seventh consecutive weekly outflows, during which $56 billion was redeemed. Rallies are hard to sustain in this environment.
The S&P 500 rallied strong in the first two sessions, but only to falter in the last couple of sessions. Through Wednesday’s high, the large cap index was up 6.2 percent, which was cut short to a gain of 1.5 percent by the end of the week, in the process forming a weekly shooting star.
Tuesday’s gap-up and Friday’s gap-down also helped form an island reversal. Plus, Wednesday’s intraday high of 3807 attracted sellers, as this was essentially a test of 3,810s resistance. The index closed out the week at 3640, essentially right where near the June low of 3637.
As things stand, risks are rising the September 30 low of 3580s gets breached in the sessions ahead (more on this here).
Euro: Currently net long 43.7k, up 9.9k.
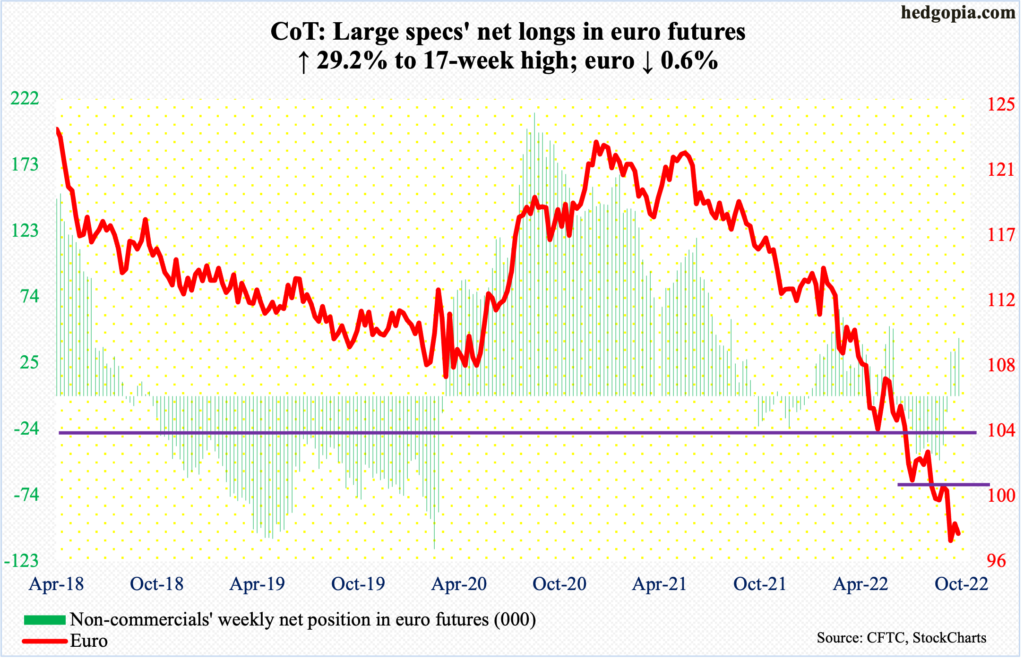
Last week’s positive momentum carried into the first two sessions this week as the euro reached parity at Tuesday’s high, but the session’s gap-up was filled in no time. The currency dropped in the latter three sessions, ending at $0.9739, down 0.6 percent for the week, forming a huge shooting star on the weekly.
Despite all this, last week’s low of $0.9559 still has the potential to be an important low.
Gold: Currently net long 88.4k, up 36.3k.
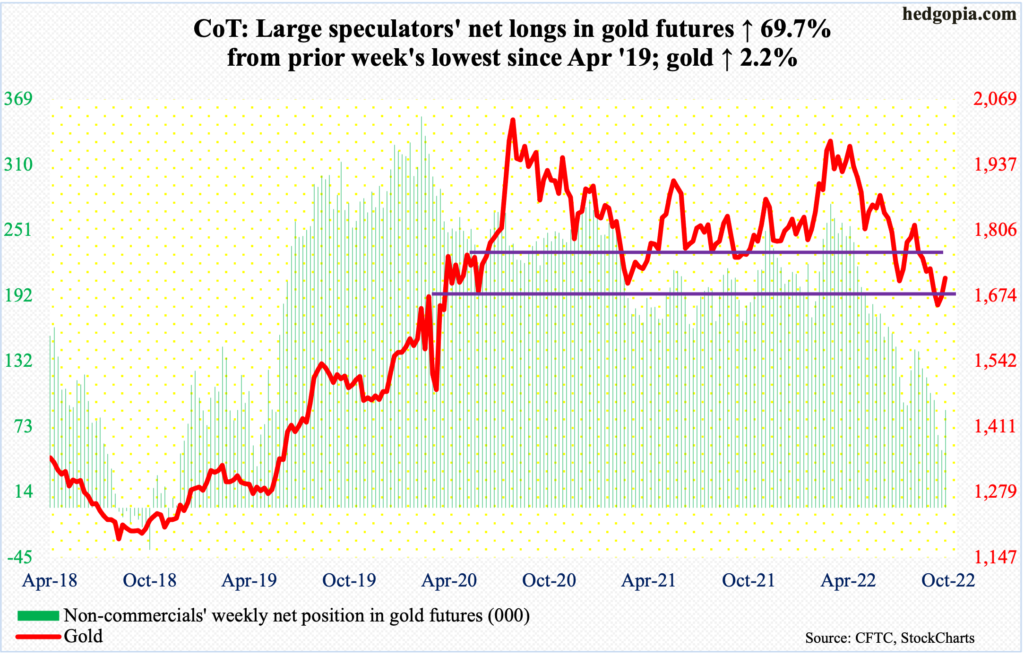
Gold ($1,709/ounce) rallied for the second straight week, up 2.2 percent. Crucial resistance at $1,760s-$1,770s was sort of tested – unsuccessfully. On Tuesday, the yellow metal tagged $1,739, which is about where the 50-day ($1,735) lies; gold bugs tried to take out the average on Wednesday and Thursday as well, but to no avail.
There is horizontal support at $1,660s-$1,670s, which, going back to the early months of 2020, was tested several times, including this July.
A decisive loss of $1,660s-$1,670s may eventually open the door toward $1,560s. Worse, longer-term, there is dual support at $1,360s – horizontal going back to the latter months of 2010 and a rising trendline from December 2015 when gold bottomed at $1,045.
Nasdaq 100 index (mini): Currently net short 3.8k, up 3.7k.
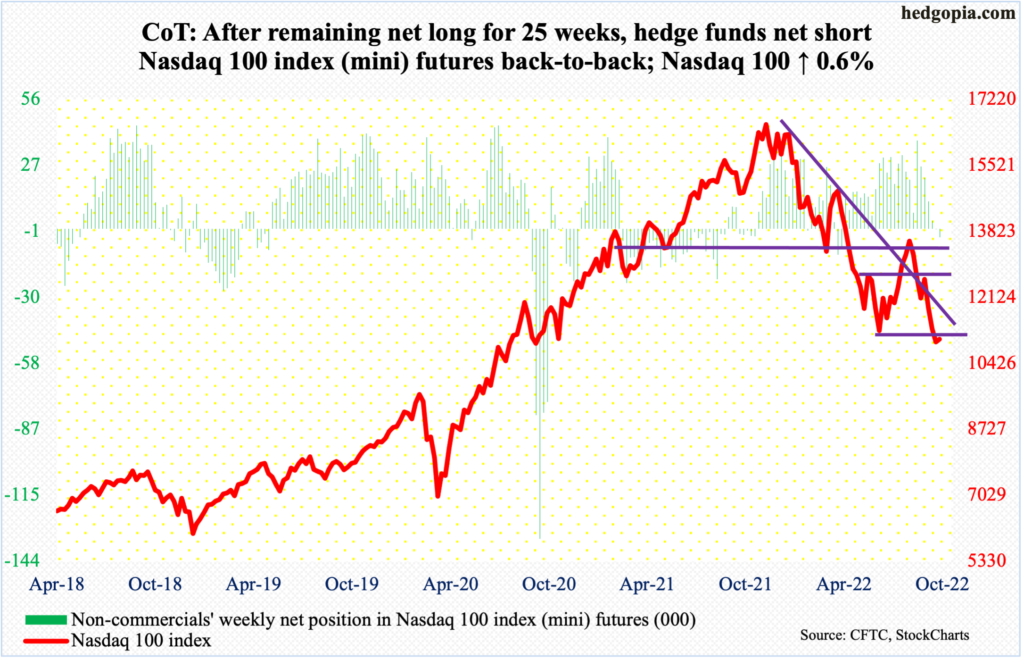
Through Thursday’s intraday high of 11661, the Nasdaq 100 was up 6.3 percent for the week, before sellers showed up. By the time the gravestone doji week was over, the tech-heavy index was only up 0.6 percent, to 11039, which is less than three points from the June 16 low of 11037. In fact, last Friday’s intraday low of 10967 slightly breached these lows, but nothing major. Not yet anyway.
As was the case with the S&P 500, the Nasdaq 100 also formed an island reversal last week. Friday’s weak tape can persist in the sessions ahead.
In this regard, bears are probably eyeing 10589, which is a 61.8-percent Fibonacci retracement of the surge from March 2020 to last November’s record high. If this scenario comes to pass, the index will have fallen 36.8 percent from the peak. Through last Friday’s low, it was down 34.5 percent.
Russell 2000 mini-index: Currently net short 99.2k, down 6.9k.
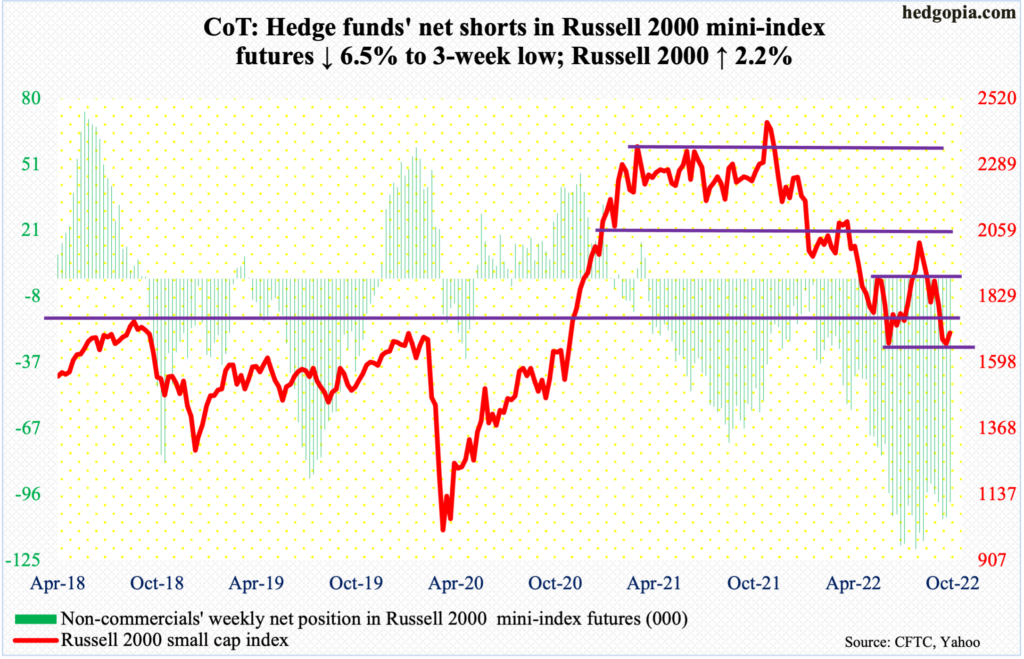
Last week, the Russell 2000 ticked 1651 intraday Tuesday, leaving the June low of 1641 intact; in comparison, both the S&P 500 and Nasdaq 100 breached the mid-June lows. This week, too, the June low was never challenged, as the week’s lowest print of 1672 was recorded on Monday.
The small cap index closed above 1700 in all five sessions, with Tuesday tagging as high as 1776; 1700 is where the index broke out of in November 2020. Between mid-June and mid-July this year, the level was defended several times.
The index closed out the week at 1702. A decisive recapturing of 1700 opens the door toward 1800, and then 1900.
Even so, a test of 1640s-1650s is possible in the sessions ahead.
US Dollar Index: Currently net long 31.7k, up 1.1k.
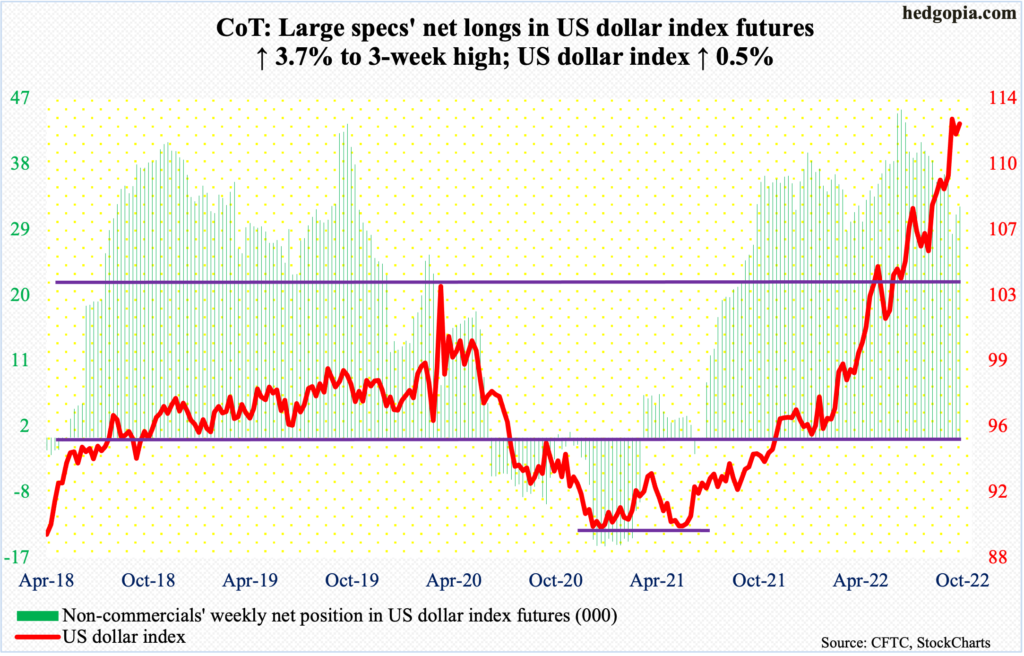
Last week’s downward momentum continued early on this week, with the US dollar index down 1.8 percent at Tuesday’s low. It then rallied the next three sessions to end the week up 0.5 percent to 112.68, forming a potentially bearish hanging man on the weekly.
This follows last week’s reversal-looking weekly candle, rallying as high as 114.75 and closing at 112.08. To boot, the index rallied 3.1 percent last month – its fourth straight up month and eighth in the last nine – but still left behind a long upper wick.
That said, in favorable circumstances, the dollar index can rally on the daily, but remains way overbought on both the weekly and monthly. In the event of downward pressure, nearest support lies at 109.10s, followed by the all-important 104.
VIX: Currently net short 69.5k, down 13.2k.
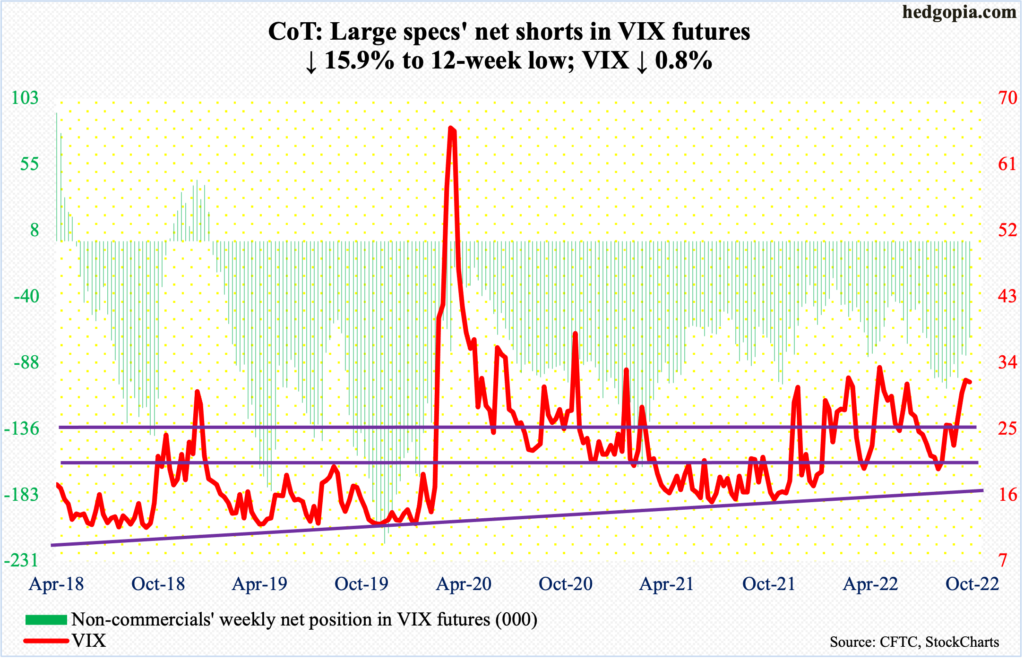
Last week, VIX ended with a weekly spinning top, which also formed in the week of June 3. Back then, the volatility index went on to drop for eight straight weeks. This time, too, VIX fell 0.8 percent this week, but at the same time managed to rally from down 9.9 percent at Wednesday’s low of 28.50. It ended the week at 31.36.
It is hard to decipher if this week’s weekly candle is a hanging man, which could favor volatility bears, or a hammer, which is potentially bullish for volatility.
If non-commercials’ action is a tell, then VIX can rally. These traders reduced their net shorts in VIX futures to a 12-week low. Historically, volatility does not peak until these traders either go net long or get close.
Thanks for reading!
More By This Author:
Digestion Of Powerful Rally - Medium To Long-Term, Sentiment Remains SuppressedPeeking Into The Future Via Latest CoT Report
Investors Intelligence Bulls Lowest Since Feb ’16


Comments
Log in or sign up to join the conversation.