
What The Fed Really Said
The volatility in the markets continued this week with another big whipsaw for investors following the Fed meeting. On Thursday, the S&P soared after the Fed announced they would not be hiking rates this year and ending their balance sheet reduction by September. On Friday, the rally was reversed as the realization of what the Fed actually said sank into the markets.
In just the course of four weeks, the market has swung from overbought, to oversold, back to overbought and then began correcting back to oversold on Friday. I am exhausted just writing about it.
These swings make portfolio management very difficult. While the markets have been fairly well contained, allowing us to “hold” our long-equity exposure currently, the market continues to show signs of “exhaustion” in the recent price action. As I wrote at the beginning of the month:
“The markets are not immune to the ‘laws of physics.’ While the price action is indeed bullish in the short-term, the shorter-term moving averages act like ‘gravity’ on prices. Given the current extension and deviation above the 50-dma the odds of a pullback, before a continued advance, is a high probability.
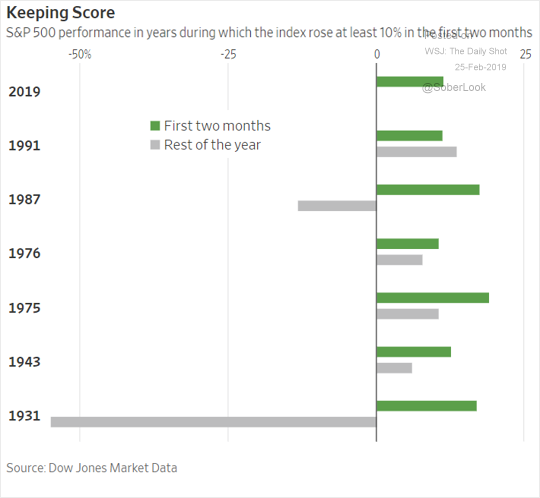
As shown in the table below, it is very likely that if you sold everything today, and went to cash, that you would miss little over the balance of the year. In other words, the bulk of the gains have likely been made for the year.”
For the month of March, the S&P 500 is up 0.61%.
Bonds, as measured by the Core U.S. Aggregate Bond index is up 1.72%
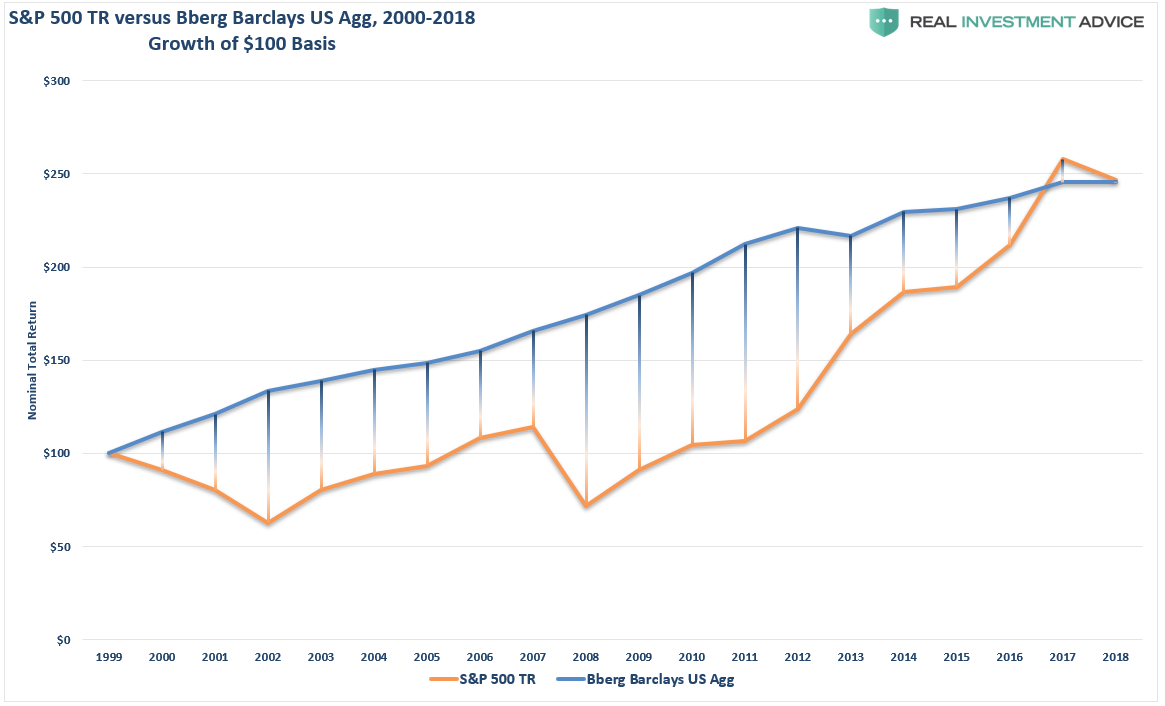
Since 2000, bonds have outperformed stocks particularly when measured on a risk-adjusted basis.
Let me say something here that you should at LEAST consider.
“Given current valuations on stocks, it is highly probable that over the next decade bonds will continue to substantially outperform stocks to a large degree.”
Now, I am not saying that you should “sell everything” and hide in cash.
What I am saying is that managing your equity portion of your portfolio to adjust for relative risk, and reduce volatility, will allow you to adhere to your investment discipline over the long-term.
While our portfolios remain long-equity, we have substantially hedged our risk with a slightly overweight cash position and fixed income.
One of the issues which keeps our portfolios hedged currently is that despite the rally from the December lows, the market both remains in a potential topping process and technical measures of price momentum continue to negatively diverge.
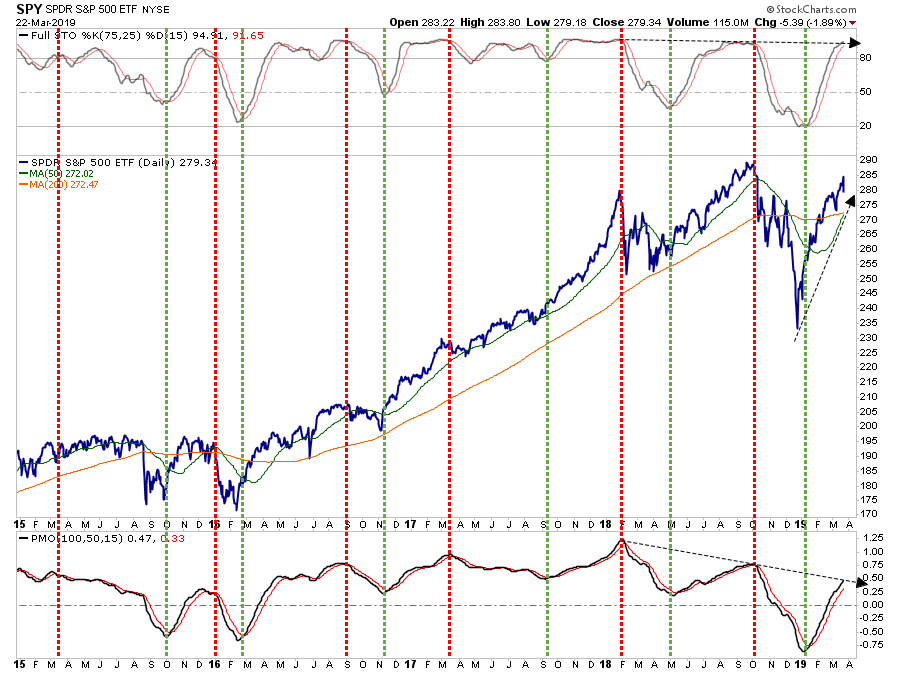
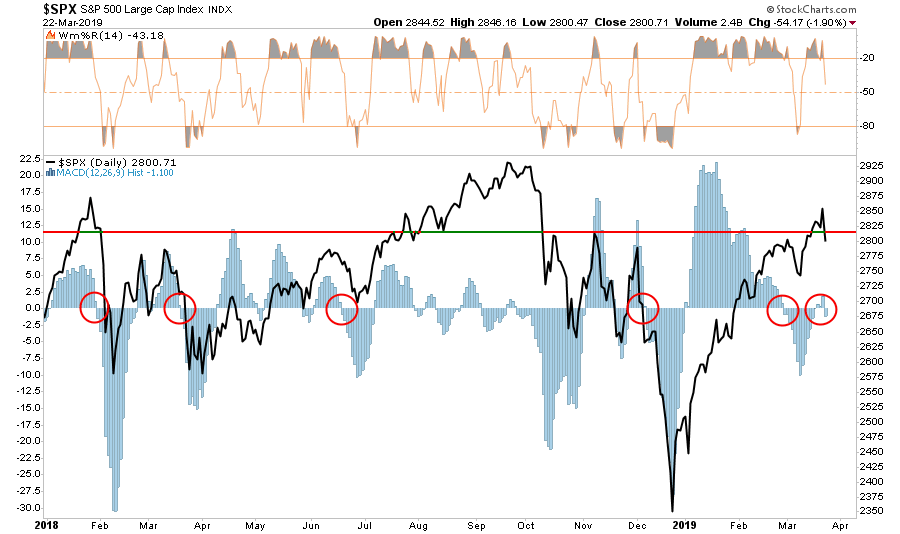
On a very short-term basis, the market has broken back below the October-November highs. Given the market is not oversold on a short-term basis, and has triggered a short-term sell signal as shown below, it is likely we will see a continued correction into next week.
I also want to remind you of the divergence between stocks and bonds as shown below.
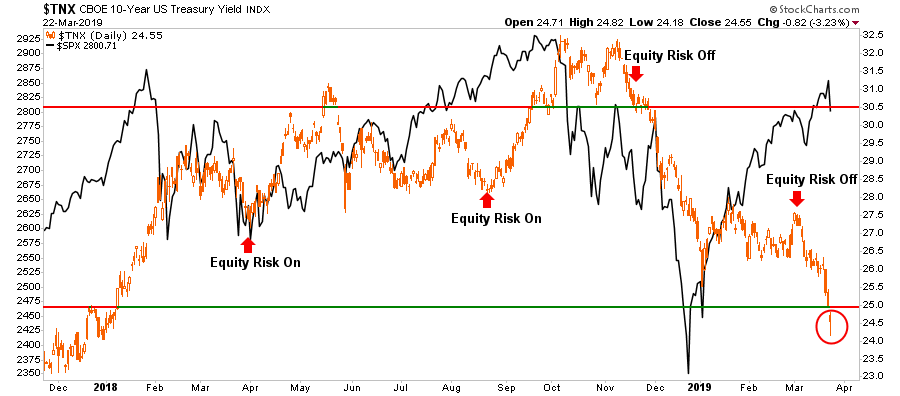
This divergence between stocks and bonds still signals that “smart money” continues to seek “safety” over “risk.” Historically, the bond market generally has it right.
The rally from the December lows, so far, remains a reflexive rally within a correction process as new highs have yet to be reached. Very long-term consolidation correction processes can be very bullish for investors provided the market eventually breaks out to new highs. However, until that happens, the correction that began in 2018 remains intact.
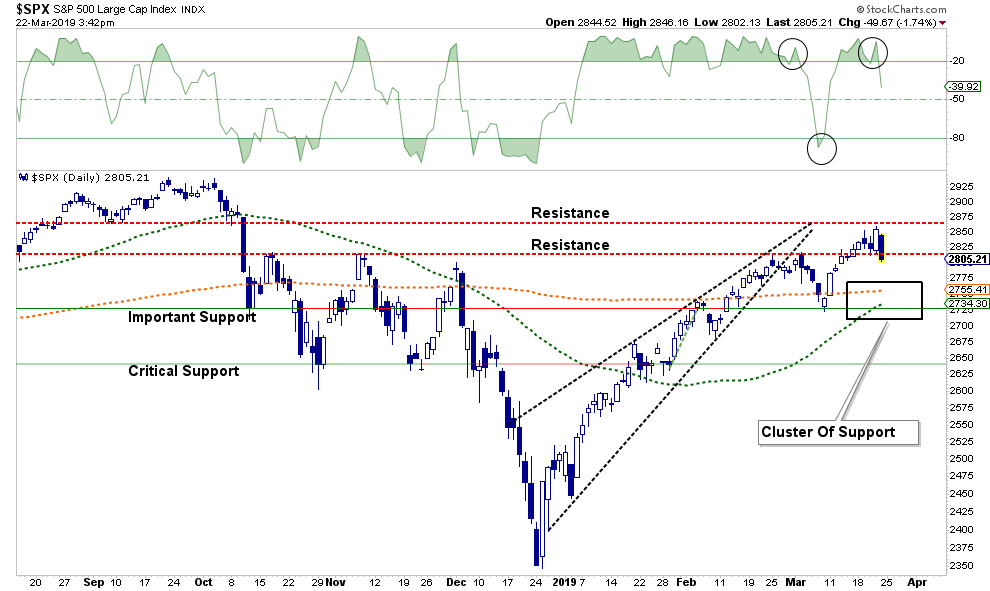
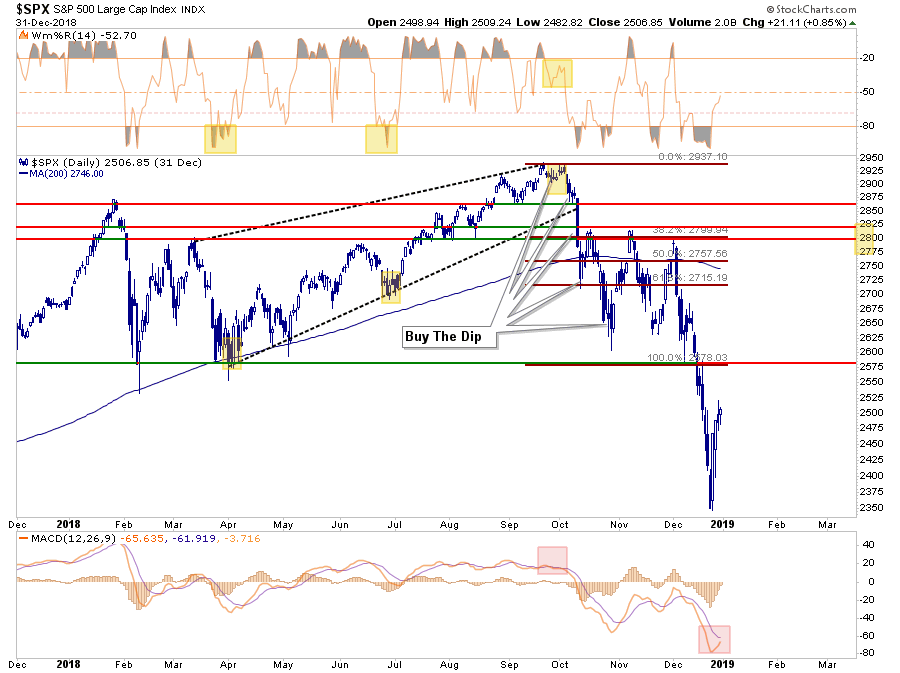
The rally from the December lows is at risk currently. The chart below shows the rally from the December lows which is currently testing the bottom of a rising wedge pattern. The difference this time is that the market is testing the bottom of the rising trend line from the lows and is not oversold (gold boxes in the top panel) as it was previously.
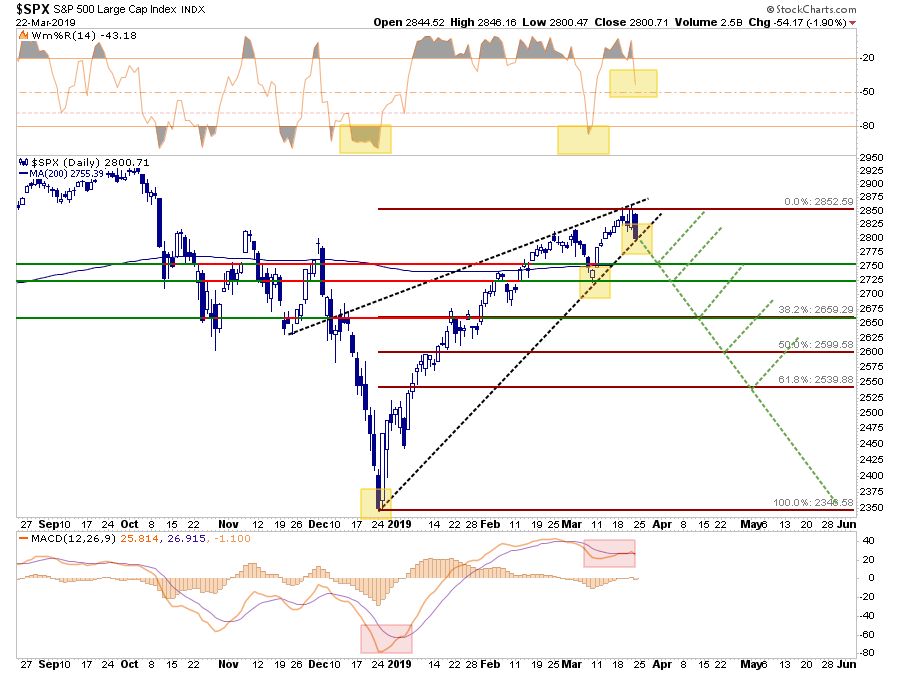
The good news is that if the market does break to the downside, there are numerous levels of logical support for the market between the current level and the December lows.
“The market will never go that low, This going to be another ‘buy the dip’ opportunity.”
Before you jump into that particular pond consider the following:
In March and April of last year, I laid out reasons why the “bull market” had ended for the time being. While such a statement is always misconstrued as“Lance just said the markets are going to zero,” all it means is that the market is unlikely to advance for some time.
Of course, the markets hit new highs in June of last year bringing out all manner of trolls to point to how my analysis was wrong and the “bull market lives.” At that juncture, if we ran the same analysis on a retracement as in the chart above, the “buy the dip opportunities” were just as prevalent and a retest of February lows seemed just a laughable.
By December, there were few that were laughing.
Which brings us to why the markets are likely to retest lows, or worse, during the remainder of 2019.
What Did The Fed Really Say?
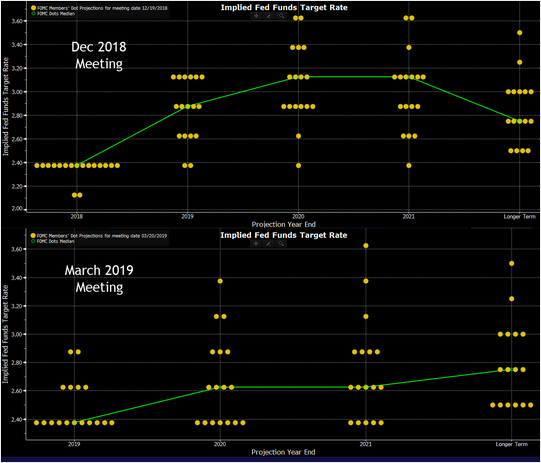
In a widely expected outcome, the Federal Reserve announced no change to the Fed funds rate but did leave open the possibility of a rate hike next year. Also, they committed to stopping “Quantitative Tightening (or Q.T.)” by the end of September.
As we noted in our missive following the announcement:
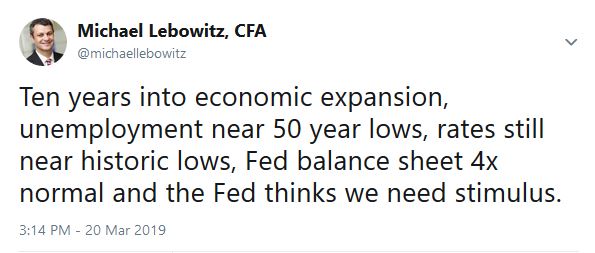
“What is interesting is that despite the language that ‘all is okay with the economy,’ the Fed has completely reversed course on monetary tightening by reducing the rate of balance sheet reductions in coming months and ending them entirely by September. At the same time, all but one future rate hike has disappeared, and the Fed discussed the economy might need easing soon. To wit, my colleague Michael Lebowitz posted the following Tweet after the Fed meeting:”
Naturally, all the market “heard” was the Fed is “returning the punch bowl” which sent stocks soaring on Thursday. Via the WSJ:
“On Wednesday, the Fed had given the market what it wanted in December. On rates, the Fed signaled it is indefinitely on hold due to heightened risks to the global economy and because strong U.S. growth and falling unemployment last year didn’t deliver an expected upturn in inflation.
On the portfolio, most Fed officials still don’t believe the runoff of their mortgage and Treasury holdings played a major role in the market’s swoon late last year.“
The last sentence made me chuckle, because if they TRULY believed the extraction of liquidity from the markets didn’t have an impact on the markets, then why the quick decision to stop reducing it. Maybe because of this:
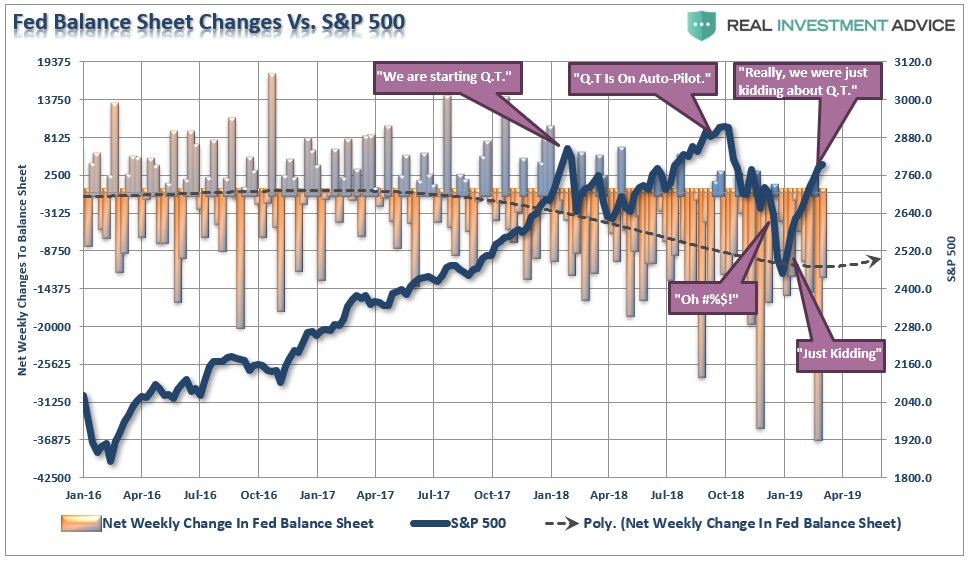
But let’s talk about what the Fed REALLY said.
Over the past several months we have noted that weaker rates of economic growth was going to severely limit the Fed’s ability to hike rates. Even though the Fed made a point to note the U.S. economy remains solid, they rather dramatically lowered their outlook for the U.S. economy not only in the short-term but over the long-term as well.
As Barbara Kollmeyer noted asked on Friday:
“Does the Fed know something investors don’t?”
Given the rapid reversal on policy given just one little hiccup in the economy and the markets, one should wonder.
To answer Barbara’s question, “yes.”
The Fed’s comments are NOT supportive of higher asset prices driven by stronger profit growth. What investors picked up on Friday was this:
“A weaker outlook for the economy means weaker profit growth. As such, this puts a market currently valued at 30x earnings at risk of a repricing to equate it with reduced expectations for future cash flows.”
As my friend and colleague Doug Kass noted on Friday there are substantial impediments to the economy and markets in the near-term which support the Fed’s reversal.
- “Negative or near zero interest rates represent conditions that understandably exist immediately following a deep recession, not 10-years after.
- Fewer Tools Left in the Policy Shed as the Fed ends the tightening cycle with the absolute and real Federal Funds rate several hundred basis points lower than any economic cycle in history.
- Debt Is a Governor to Growth and debt that is not self-funding is future consumption brought forward.
- Deficit and Demographic Threats combined with a Fed balance sheet, which is four times normal, and slowing population growth, diminish intermediate to longer-term economic and profit growth prospects. Such is not supportive of higher valuations or asset prices.
- No Country Is an Economic Island and the lack of coordination between the super economic powers in the world will likely exacerbate worldwide economic risks.
- The Misallocation of Resources Causes Bubbles and low interest rates which we have experienced for years have always – in every cycle – been a source of “mischief” and a misallocation of resources. The only question is “when” something breaks it will ripple through the financial markets like a tidal wave. (Think about the proliferation of ‘covenant-lite’ loans.)”
As stated, these risks, which we have chronicled many times in the past, are not lost on the Fed. They realize that by continuing to hike interest rates, and tighten monetary policy, they are exacerbating the risk of something “breaking.”
However, they may already be too late, as the bond market is already sniffing out the problems. Currently, 5 out of 10 yield curves we track (50%) are now inverted. Such is the highest risk of a recessionary onset as we have seen since 2007.
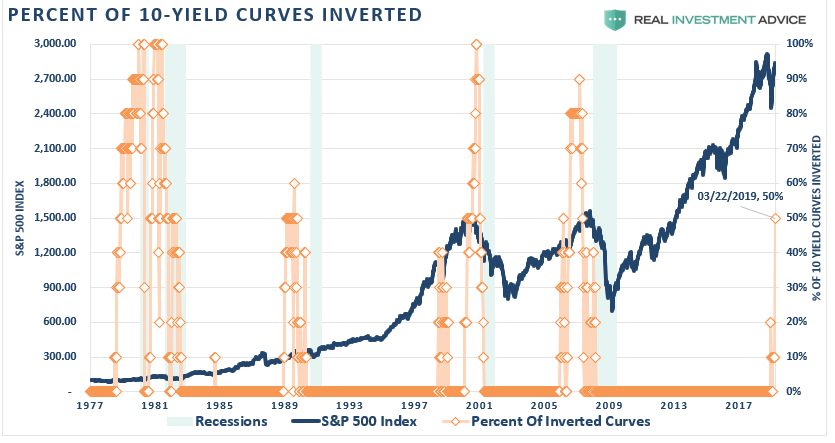
WARNING: An inversion of the yield curve in and of itself DOES NOT mean the market will immediately crash and a recession will start. As you will notice in the chart above, once the inversions begin, the recession doesn’t start, historically speaking, until the inversion is reversed.
Why is that?
Because, when the recession starts, money is coming out of “risk” and moving into instruments affected by the shortest-end of the yield curve. (Money markets, CD’s, etc.) This causes yields to plummet faster on the short–end than on the long-end which reverses the inversion. However, overall yields are still falling.
You don’t want to wait for that to happen as the damage to your equity portfolio will be substantially larger than you can you fathom currently. Furthermore, as noted last weekend, the yield curve is simply acknowledging the rising risks of a recessionary onset.
Despite numerous articles at end of last week continuing to encourage retail investors to ignore the warnings and stay invested in the stock market (without a safety net), you might want to pay attention to what institutional investors are doing with their money. You will notice that“defensive” positioning is in demand currently.
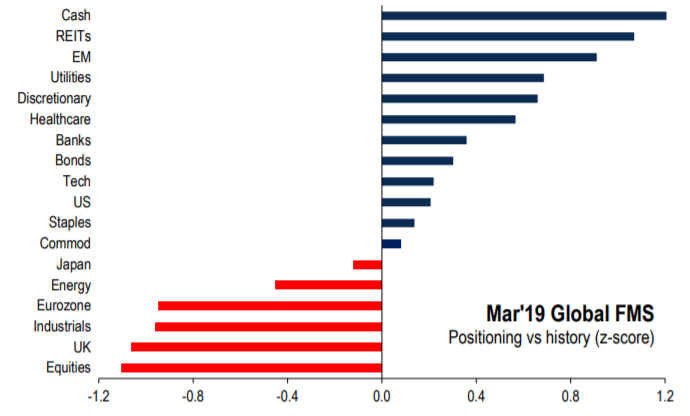
Clearly, professional investors have continued to pile into fixed income and safer equity income assets over the last several months despite the sharp ramp up in asset prices. This demand for “yield” and “safety” has been one of the reasons we have remained staunchly bullish on bonds in our portfolios as of late despite continued calls for the “Death of the Bond Bull Market.”
Charlie McElligott noted on Friday the three most important points about low interest rates (h/t Zerohedge)
- Low interest rates are (ultimately) deflationary, sustaining zombie-firms in a “liquidity-trap,” which weigh on overall economic performance while also weakening investment.
- Low interest rates and QE are deflationary as you incentivize mal-investment and blow perpetual speculative-asset bubbles, which (ultimately) correct and drive deleveraging—thus the ‘balance sheet recession.’
- As there is still a lot of debt-related “scar tissue,” you can’t push credit on a string. This then leads to quick “muscle memory” returns to a defensive posture: “If there is no return on capital, capital should not be deployed.”
Here are the most important takeaways from all of this:
- Despite an expected uptick in economic growth in Q2, look for weaker economic growth through the end of this year and into 2020.
- Employment is set to weaken markedly over the next 12-24 months.
- Wage growth gains will also reverse as tightness in the labor force eases.
- Inflationary pressures will remain non-existent as debt, disruption, and demographic forces continue to suppress economic growth.
- Go back to #1.
This is the cycle we are likely locked into currently and will continue to play out over the next several quarters.
Let me add to our list of actions from last week:
Simple Actions To Take Now, You Will Appreciate Later
- Trim positions that are big winners in your portfolio back to their original portfolio weightings. (ie. Take profits)
- Sell underperforming positions. If a position hasn’t performed during the rally over the last three months, it is weak for a reason and will likely lead the decline on the way down.
- Positions that performed with the market should also be reduced back to original portfolio weights. Hang with the leaders.
- Move trailing stop losses up to new levels.
- Review your portfolio allocation relative to your risk tolerance. If you are aggressively weighted in equities at this point of the market cycle, you may want to try and recall how you felt during 2008. Raise cash levels and increase fixed income accordingly to reduce relative market exposure.
- Look to reposition portfolio composition from “risk” toward “safety.” Look to reduce assets specifically tied to economic growth and increase holdings in assets which tend to be more defensive in nature.
- If you just don’t know what to do – cash is the best alternative. With cash now yielding more than the S&P 500, holding cash IS an option until you figure out what to do. Remember, investing is about making a bet where the potential for reward outweighs the risk of loss. If you can’t find that opportunity right now, cash is the best alternative until you do.
How you personally manage your investments is up to you. I am only suggesting a few guidelines to rebalance portfolio risk accordingly. Therefore, use this information at your own discretion.
THE REAL 401k PLAN MANAGER
A Conservative Strategy For Long-Term Investors
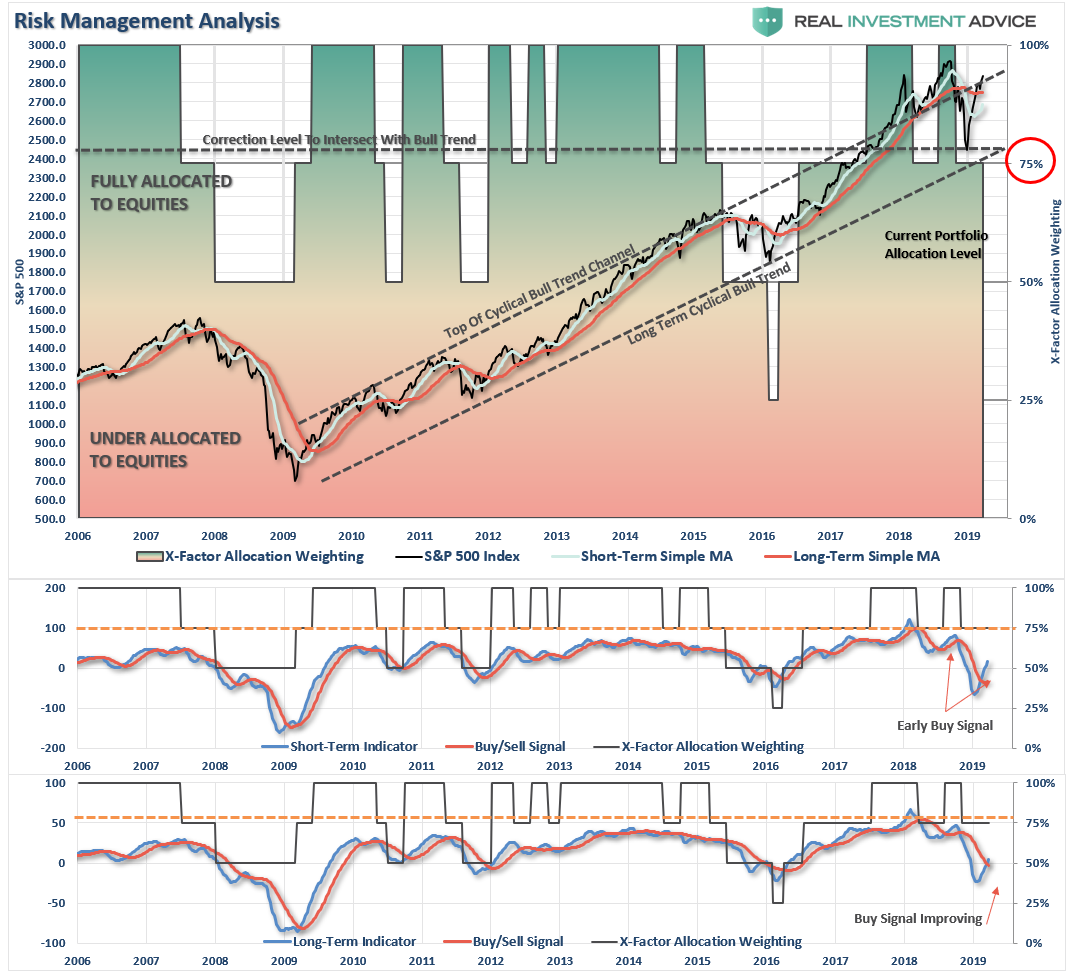
There are four steps to allocation changes based on 25% reduction increments. As noted in the chart above a 100% allocation level is equal to 60% stocks. I never advocate being 100% out of the market as it is far too difficult to reverse course when the market changes from a negative to a positive trend. Emotions keep us from taking the correct action.

Patience Pays Off
Last week, we stated to remain patient despite the market rally:
“The sharp rally in stocks has gone too far, too quickly, so just be patient here and wait for a correction/consolidation to increase exposure. The rally this past week was positive but remains very narrow in terms of participation.”
As noted all throughout this week’s missive, the reversal of the Fed has led the markets to reconsider their position of ignoring rising economic risk.
Of course, over the last several weeks we have repeatedly warned this was THE risk.
“Take a look at the chart above. Beginning in 2016, I drew a bull trend channel for the market in the chart above (the dashed 45-degree black lines) which have contained the bull market rally since the 2009 lows.
In January 2018, the market made, as we stated then, and unsustainable break above that upper trend line. I add the horizontal black dashed line at that point and said that ultimately we would see a correction back the long-term bull trend line.
Since then, exactly that has happened and rather than the market retesting the lower bullish trend line and then beginning a more normal advance, the market rocketed higher in 2-months to hit AND FAIL at the upper bullish trend line.
If the last decade provides any clues, it is likely the market is going to remain range bound within this rising trend for now, which suggests that waiting for a better entry point to increase exposure will be rewarded.”
As we noted last week, continue to remain patient. The underweight equity exposure continues to provide risk-adjusted performance.
- If you are overweight equities – take some profits and reduce portfolio risk on the equity side of the allocation. However, hold the bulk of your positions for now and let them run with the market.
- If you are underweight equities or at target – just sit tight for now and let’s see what happens next.
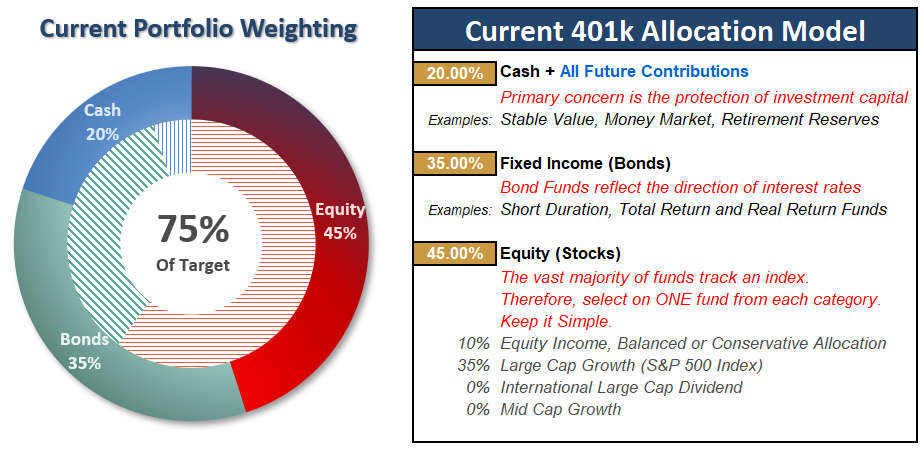
Current 401-k Allocation Model
The 401k plan allocation plan below follows the K.I.S.S. principle. By keeping the allocation extremely simplified it allows for better control of the allocation and a closer tracking to the benchmark objective over time. (If you want to make it more complicated you can, however, statistics show that simply adding more funds does not increase performance to any great degree.)
401k Choice Matching List
The list below shows sample 401k plan funds for each major category. In reality, the majority of funds all track their indices fairly closely. Therefore, if you don’t see your exact fund listed, look for a fund that is similar in nature.


Imo, good financial advice for the individual investor.