
Weekly Market Pulse: You Cannot Be Serious

Image Source: Pixabay
You can’t be serious! You cannot be serious!
John McEnroe, challenging a fault call at Wimbledon, 1981
That’s what went through my head when President Trump unveiled his “reciprocal” tariffs on Wednesday last week. The tariffs unveiled on Trump’s “Liberation Day”:
- are the largest tax increase since at least 1968 and maybe in our entire history.
- impose an average tariff rate of about 25%, higher than the rates imposed by the Smoot Hawley Act of 1930. We have had higher tariffs in our distant past but what we did as an emerging market of the 19th century doesn’t bear much resemblance to today. One big difference between 1930 and today is that trade is a bigger part of our economy today (roughly 25% vs less than 10% then). Smoot Hawley is considered by most economists to have worsened the Great Depression.
- are not reciprocal since the “tariffs” listed for each country bear no resemblance to the actual figures.
- use a formula to determine our “reciprocal” tariff that supposedly includes non-tariff barriers such as subsidies and currency manipulation. The formula does no such thing; it is based entirely on our bilateral trade deficit with each country. The administration claims that “persistent trade deficits are due to a combination of tariff and non-tariff factors that prevent trade from balancing”. This displays a stunning ignorance of the most basic concept in trade economics – comparative advantage. Trade deficits have lots of causes, only some of them due to “cheating” by our trade partners. It is unclear who was responsible for the “reciprocal” tariff formula but the US Trade Representative website published it. Oren Cass, a protectionist activist at American Compass, appeared to take credit for it in an X post. In a later X post he asked how comparative advantage could possibly cause a trade deficit. This is literally taught in high school using a simple triangular trade route model. Cass’s posts appear to have been deleted over the weekend.
- uses an incorrect value for one of the variables. The paper they cited was very specific about why the variable they used is wrong but they used it anyway. If they had used the correct value, none of the tariffs would have exceeded 14% and most countries would have been 10%. Their error amplified the “reciprocal” tariffs by a factor of four. Furthermore, the trade deficits used for the formula are for goods only and do not take into account the US’s large trade surplus in services. A truly reciprocal tariff would have likely had an average of less than 10%.
- were imposed on several islands with no human inhabitants as well as Diego Garcia, a joint UK/US naval based in the Indian Ocean. Most of the highest tariff levels were on very poor countries: Lesotho, Cambodia, Laos, Madagascar, Vietnam, Sri Lanka, Myanmar, Falkland Islands, Syria, Botswana, etc.
- are supposedly justified by the International Emergency Economic Powers Act of 1977. The authority to impose tariffs on every country in the world is not in the law. And yes, I read it. A lawsuit has been filed by a Florida company challenging the legality and constitutionality of the tariffs.
The markets have reacted poorly to the announced tariffs with stocks down 9% on the week and now down 17% from the highs in February (S&P 500). Every sector of the market posted losses. Bonds were the only asset class in our portfolio to post a gain for the week. Crude oil fell 10%, copper was down 14% and even gold fell 1.5%. The dollar, which is normally a safe haven during market turmoil, fell 1%. Trade theory says the currency of a country imposing tariffs should rise (or more accurately, the currency of the country on which the tariffs are imposed should fall to offset the impact of the tariffs) but that assumes “ceteris paribus” – all other things equal – which they most certainly are not. In this case, China retaliated almost immediately and it seems likely that we’ll see more from the EU this week. This seems a good time to bring up, again, that awful paper by the Chair of the Council of Economic Advisors, Stephen Miran (A User’s Guide To Restructuring the Global Trading System). The one thing he said in that paper that I agree with is that this is a high risk strategy with a narrow window for success. One of the requirements for that success is that other countries do not retaliate when we impose tariffs. The window just got narrower.
There is a path by which the Trump Administration can reconfigure the global trading and financial systems to America’s benefit, but it is narrow, and will require careful planning, precise execution, and attention to steps to minimize adverse consequences.
Stephen Miran, A User’s Guide To Restructuring the Global Trading System
What got rolled out last week missed on all three of his requirements.
Like everyone else, I am nervous about what happens next which is not an ideal way to make investment decisions. In situations like this we have to go back to first principles and try to ignore our emotional response. The very first principle of investing is to have a sound strategy and stick to it. The strategy we use has been successful historically in a wide range of economic conditions and I think it will continue to serve us well. Our portfolios are widely diversified, exactly what you want in uncertain situations. The strategy is based on sound investment principles and there is no reason to change it. There may be tactical changes we can make but the strategy remains the same. If you have a proven, defined strategy, stick to it. If you don’t have a defined strategy, get one.
From a tactical point of view, the first thing we need to do is review our main economic indicators to see how the market views the tariff changes.
- LT Interest rates – The 10 year nominal Treasury note yield has fallen from 4.8% at its peak on 1/13 to today’s 3.99%, a total of 81 bps. The 10 year TIPS yield has fallen from 2.34% to 1.78% over the same time frame or 56 bps. On its face that means that real growth and inflation expectations have both fallen. A reduction in real growth expectations of 0.50% to 0.75% is not a disaster but it puts us closer to the edge of recession. It also doesn’t incorporate any retaliation beyond what China announced last week. More retaliation will probably push yields down further. We also have to be aware that interest rates are affected by things other than investor’s perceptions about future growth and inflation.
- ST Interest rates – The 5 year nominal Treasury note yield has fallen 89 basis points since its peak in January while the 5 year TIPS yield has fallen 83 basis points. With the change in rates at the 5 year horizon almost exactly the same as the 10 year, I take that to mean the market believes the growth slowdown will be persistent over a long time horizon. The 2 year Treasury note yield has fallen 74 basis points which mostly reflects rising expectations for Fed rate cuts.
- Credit spreads – The difference in yield between risky bonds and Treasuries has widened since January from 2.59% on 1/21 to 4.01% as of Thursday afternoon (that probably widened further on Friday but I don’t have access to that data yet). The long term average spread is 5.27% so we are still below the average but a rapid widening is signaling risk aversion. If spreads widen further and move over the long term average, the odds of recession will rise further than they already have. This is the indicator that has me worried the most.
- Yield curves (term spreads) – In general, steeper curves are associated with greater future economic growth and flatter or inverted curves are associated with lower future economic growth. That is not carved in stone as we saw when multiple term spreads turned negative in 2022 and stayed negative until late last year. However, the 10 year/3 month curve we put the most emphasis on has recently been flattening and turned negative again last month. The curve peaked on 1/14 at 47 basis points and currently stands at -25 basis points. Again, that is consistent with lower future economic growth in the near term. The 10 year/2 year curve, by contrast, is still in an uptrend, although it is 3 bps below its January peak.
- The US Dollar – The dollar tells us mostly about changes in relative growth expectations between the US and the rest of the world. As you can see just below, the dollar is down recently but only about 1.25% over the last year. The more recent action, however, would seem to indicate that the market believes the Trump tariffs will be more damaging to the US than the rest of the world. The US is about 25% of global GDP so that would seem to make sense. However, as with bonds, there are a lot of things moving the dollar and it isn’t all about relative growth expectations. Capital flows, for instance, will be impacted by changes in fiscal policy around the world and Europe has just promised to ramp up infrastructure and defense spending by about $2 trillion. That capital has to come from somewhere and we all know what that means. There is also the matter of how the rest of the world perceives us and our reputation is taking a hit right now. Trump’s tariffs last week abrogated several free trade agreements; trust and the rule of law are hard to establish but easy to destroy.
Overall, the economic fallout from the Trump tariffs, as seen through the eyes of the market, appears to be negative but fairly modest. The natural question then is why have stocks fallen so far, so quickly? I think there are several answers for that starting with the fact that US stocks were very highly valued before the tariff changes. I have written repeatedly over the last few years about the risk of high valuations and more recently about the AI mania. It was only a matter of time before stocks corrected and the tariffs – and the emergence of cheaper AI from China – may have just been the catalyst. Technology stocks, which still make up the largest part of the S&P 500 at a 30% weighting, were the most overvalued and they have corrected the most, down over 21% YTD. Consumer discretionary stocks (cyclicals in the chart below) are more directly affected by tariffs and are down the second most at -18.5%. Meanwhile, the average stock in the S&P 500 is down just 9.5%.
The other explanation for the poor relative performance of stocks is that tariffs are likely to have a negative impact on margins. We don’t know yet how much of the increased prices associated with tariffs will be passed through to consumers and how much will come out of corporate margins but the market’s opinion is pretty obvious. Growth and inflation expectations have fallen and that probably means companies won’t be able to pass through the increased costs. Corporate earnings will be affected by slower growth and by margin compression but how much is from each component is hard to say. I’d bet more on margins than growth but at this point it really doesn’t matter. The important thing is that earnings expectations are getting marked down and so are stock prices.
Will the correction in growth – AI, Mag 7, whatever – continue? Will value continue to outperform? Will international keep beating the US? Will small and midcap stocks snap back? Those are some of the questions we have to answer and a diversified approach to investing makes this easier. We currently use 7 different ETFs and 1 actively managed fund in lieu of the S&P 500 in the large cap portion of our portfolios and 6 of the ETFs and the actively managed fund have outperformed the S&P 500 YTD. Our one underperformer has lagged the S&P by about 1.5%. A widely diversified approach allows you to concentrate the portfolio as trends emerge. Owning international stocks last year didn’t provide much benefit but it sure has this year. The EAFE index is down less than 1% and Europe is still up 4.5%. Will it continue to outperform? That likely depends on the dollar’s future course. If it continues to fall, investments outside the dollar will benefit.
Market sentiment is very negative right now but I’m not sure it is negative enough to signal a bottom. What could turn sentiment is a an adjustment of what was announced last week. The president is loathe to admit mistakes but he could certainly blame it on his Commerce Secretary, Howard Lutnick or maybe Peter Navarro. From what I read, those are the two architects of this disaster and they should be summarily fired. The Treasury Secretary, Scott Bessent, is widely admired for his macroeconomic chops but he apparently was not consulted on this tariff rollout. I am hopeful that he will start having more input because the advice President Trump is getting right now is amateur hour. The lack of basic economic understanding by these advisors is, frankly, embarrassing. There is a need to rebalance global trade and the US does need to reduce its trade deficit. But putting 47% tariffs on Madagascar because they sell us “too much” vanilla makes no sense.
Environment
(Click on image to enlarge)

The dollar is still in the middle of the range it’s been in for the last 2 and 1/2 years.
(Click on image to enlarge)

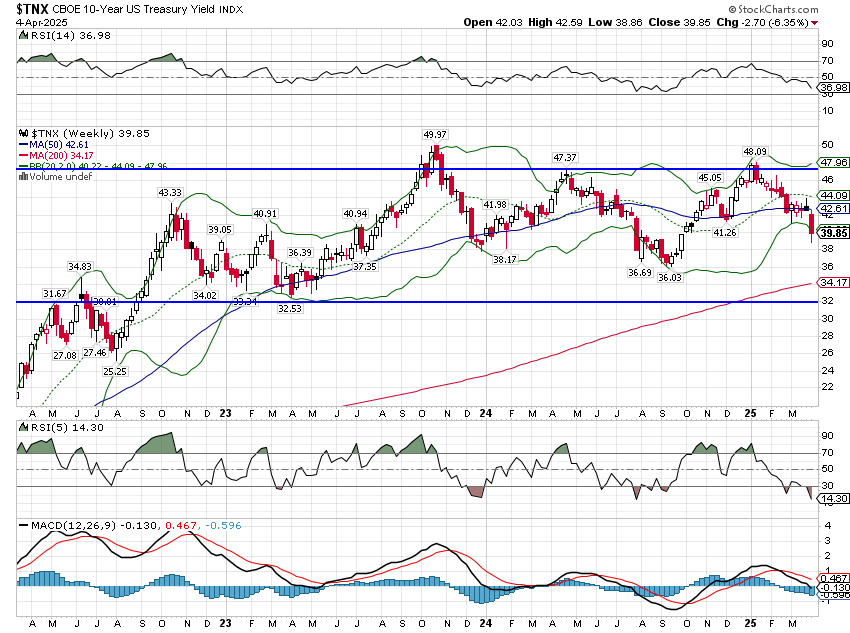
Bond yields are also in the middle of their recent range:
(Click on image to enlarge)
Markets
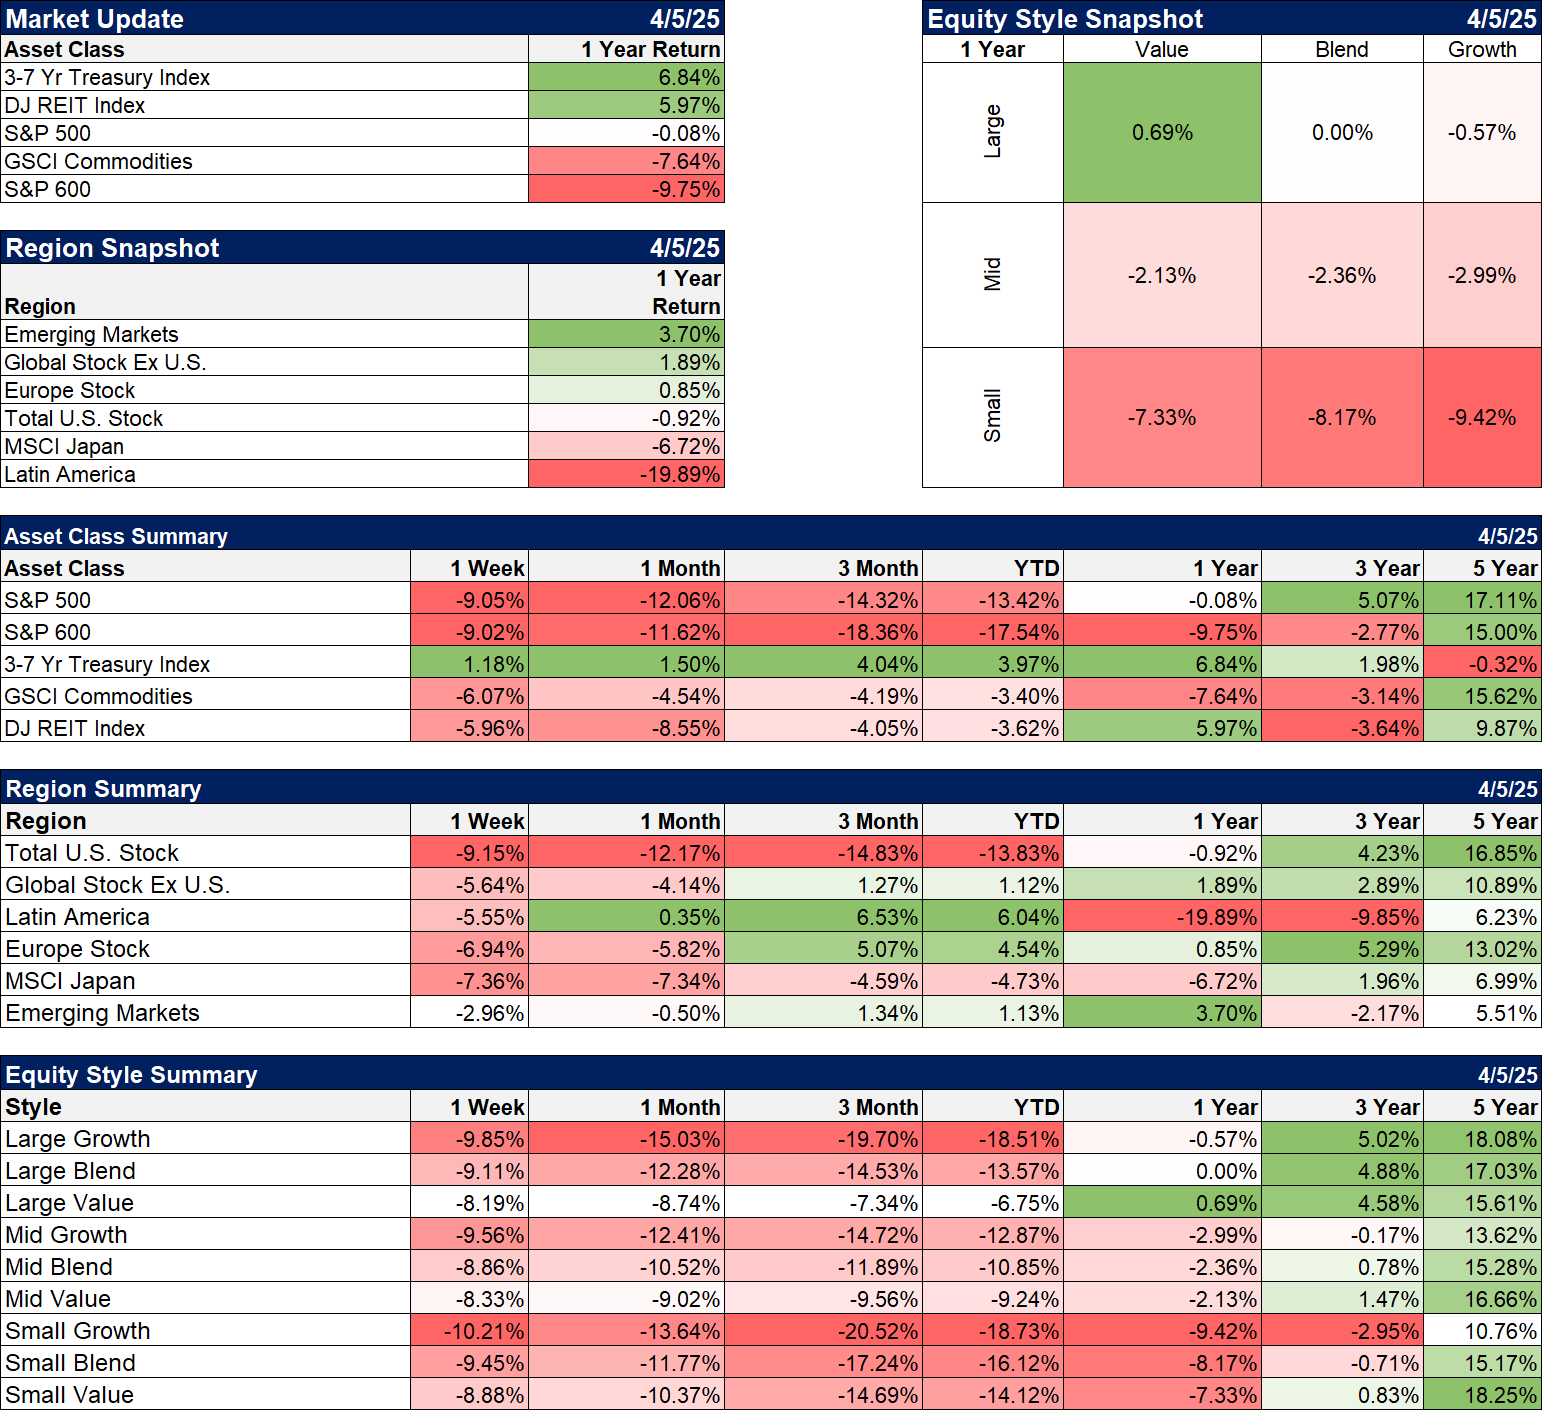
It has been a rough 3 years for investors with most diversified investors flat to down slightly over that time. We had a bear market in 2022 and it wouldn’t take much of a drop this week to make this another one. That would be the third one in 5 years which has never happened outside the Great Depression years. Let’s hope we don’t start sharing any other characteristics of that era.
In the major asset classes, the only positive returns over the last year are interest sensitive ones – bonds and REITs. Within the commodity class, gold has outperformed everything, up over 30%.
(Click on image to enlarge)
Sectors
YTD the only sector in positive territory is Consumer Defensive (staples) with utilities and healthcare – also defensive – down just a little. Over the last year the only sector with a double digit gain is utilities. No sector has produced annualized double digit returns over the last 3 years.
(Click on image to enlarge)

Economy/Market Indicators
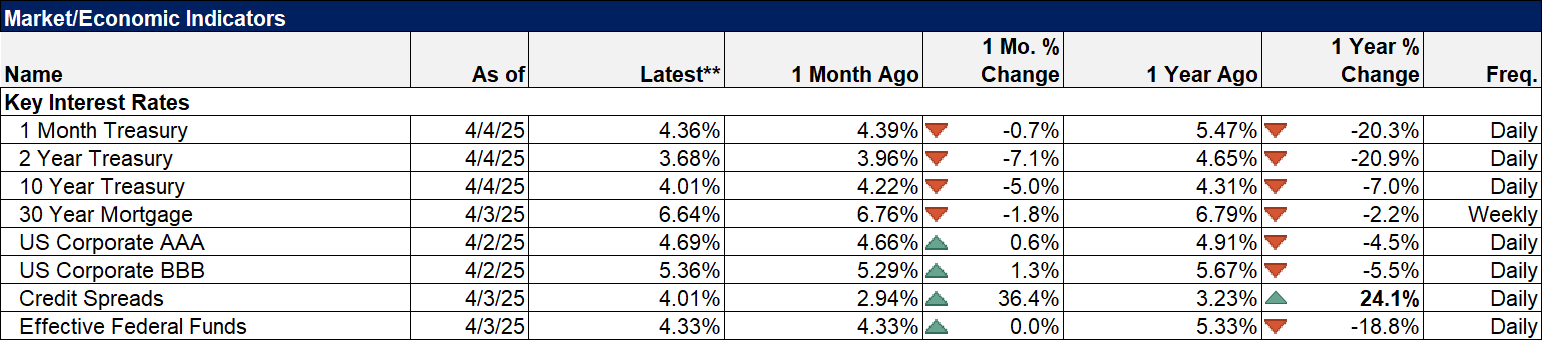
As I said above, the most worrisome economic indicator on the board is credit spreads which are up 36% over the last month. That is classic risk aversion and is a significant risk factor.
(Click on image to enlarge)
Economy/Economic Data
The economic data last week continued the string of recent weak reports. None of the reports were dire but the trend here is worrisome. The regional Fed surveys have been weak and now the ISM reports are joining in with the ISM Services last week coming in significantly below expectations. The employment data has remained fairly robust but we haven’t seen the government DOGE cuts start to hit yet. That will likely come next month and could be significant. Challenger, Grey and Christmas recently reported announced layoffs rose to 275k last month, the highest since May of 2020. If the tariffs stay in place, the economic data is almost certainly going to to get worse before it gets better.
(Click on image to enlarge)

More By This Author:
Weekly Market Pulse: The Weak Dollar Effect
Weekly Market Pulse: A Risky Plan
Stagflation Fears Grow
Disclosure: This material has been distributed for informational purposes only. It is the opinion of the author and should not be considered as investment advice or a recommendation of any ...
more

