

Image Source: Pixabay
When I first got in this crazy business nearly 35 years ago, an older advisor took me under his wing and shared with me all that he had learned over his 40+ year career. One of the first things he told me was that I shouldn’t worry about the things that everyone else was worrying about. Those things were “well worried” and already priced into the market. He said the things that cause problems are almost always things that no one is worried about. We didn’t have a pithy name for such things back then; today we call them black swans. If you want other than ordinary results you have to think differently than the crowd. It isn’t just a matter of being contrarian for contrarian’s sake because the crowd can be right for a long time – that’s what we call momentum – but if you can identify changes, in the economy or the markets, before anyone else, you can, theoretically, gain an advantage.
With that in mind, I’d like to ask you a question. When was the last time you saw an article about the yield curve? Back in the summer of 2022 articles about the inversion of the yield curve were ubiquitous. Yield curve inversions, we were told ad nauseum, meant that recession was imminent or coming soon to an economy near you or, from the more hyperbolic commentators, maybe it already started and we just don’t know it yet. When we got 2 consecutive quarters of negative GDP that year, confident pundits pointed to it and said, see, recession! But it wasn’t a recession and even the 2 quarters turned out to be false after GDP was revised later on to turn one of those quarters positive. Why did they get it wrong? Because while flat or inverted yield curves are associated with slower future economic growth, the inversion tells you nothing about how much the economy might slow or when. It could be six months or two years or more before the slowdown arrives and it could be a mild slowdown – 2001 recession – or a financial crisis – 2008. The depth of the inversion doesn’t tell you anything; it was deep in 2000 and shallow in 2007.
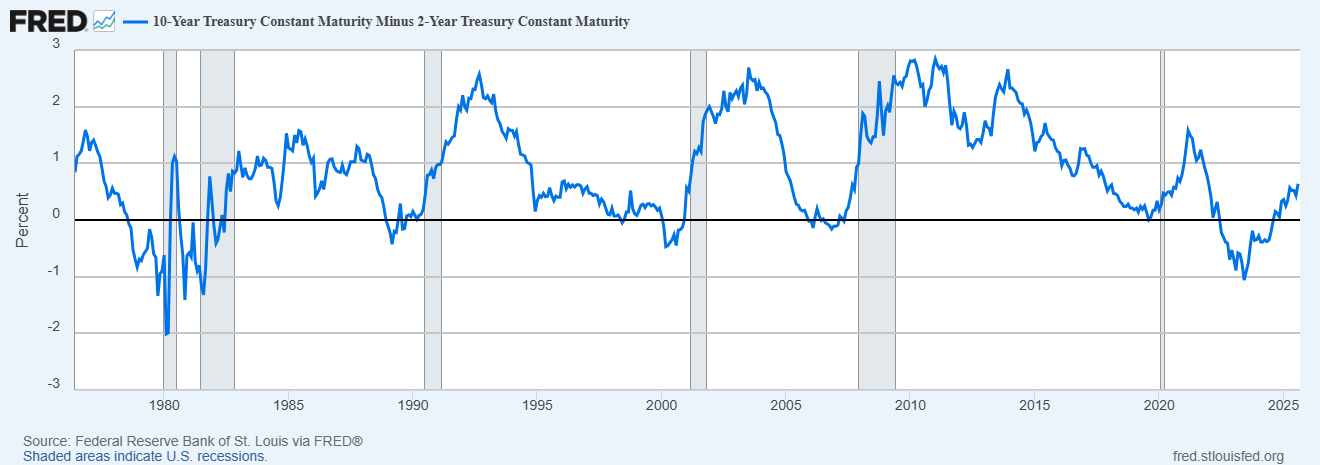
After about a year with no recession, the yield curve hit its maximum inversion in the summer of 2023 and started to steepen. This induced another round of articles about the yield curve, noting that it was the steepening after an inversion that was the signal for recession. If you just look at a chart of the yield curve you can see this looks true:
(Click on image to enlarge)
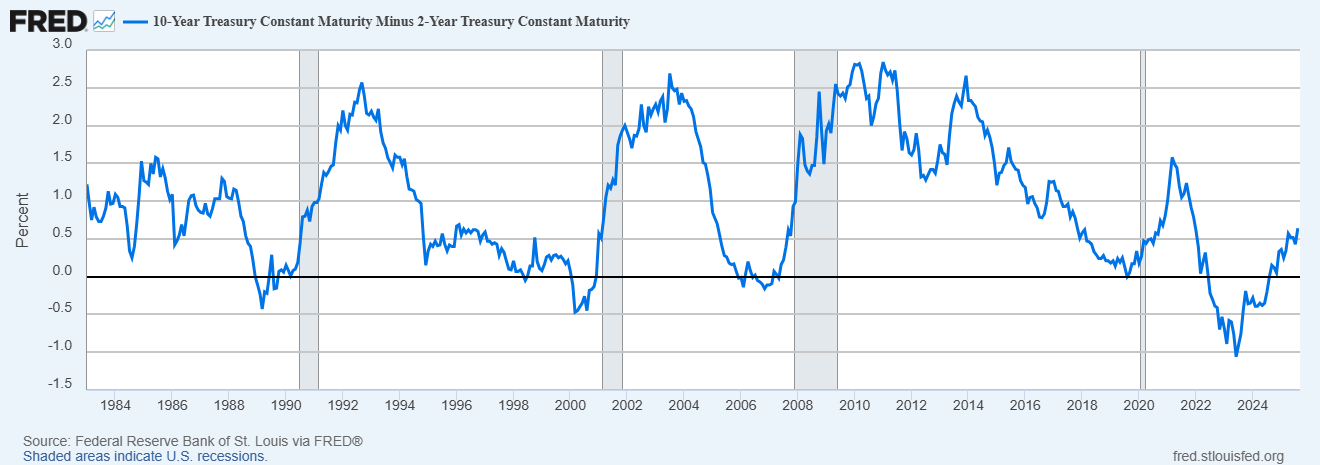
As you can see, the curve does indeed start to steepen before every recession back to the early 80s. If this picture is all the information you have, you might assume that any steepening after an inversion means recession is imminent. And yet…here we are 2 years later and still no recession. Why were the pundits wrong again? Because all they looked at was the chart and no further. If they had bothered to do some research they would have found that it matters how the curve is steepening, not just that it is. The steepening after the 2022 inversion was different than all those other steepenings that led to recession on this chart. The earlier steepenings are known as bull steepeners; they happen when short term rates fall faster than long term rates. The key is that both short and long term rates are falling; the market is anticipating weaker nominal growth.
But that isn’t what happened when the curve started to steepen in 2023. At the beginning of this steepening, both short and long term rates were rising with long rates rising faster – nominal growth (NGDP) expectations were rising. And while short term rates fell slightly in 2024, long term rates stayed fairly constant and even tested the 2023 highs twice that year (although new highs were not made). This is called a bear steepener because long term rates are rising as the yield curve steepens and it isn’t recessionary. It is most often associated with inflation fears, which makes perfect sense in the context of the time.
And so, now, here we are in 2025, with stocks sitting near all time highs and still no recession and not an article about the yield curve anywhere. The yield curve, once considered the premier recession indicator, has been cast aside because it appears to have stopped working. Well, I guess it has stopped working if your research consists of staring at a chart. In fact, the first clue that most of these market seers had no clue what they were talking about is that they talked about the yield curve, as if there was only one. There are many yield curves and only taken together do they tell us what the market expects from the future economy. Looking at only one – most people look at the 10 year/2 year Treasury spread – only gets you part of the story.
You might have guessed by now that, since no one is paying attention, I think the yield curve may be telling us something useful. You see the bear steepener has, since the beginning of this year, turned in to a bull steepener. Yes, the type of steepener we often see before the onset of a slowdown. The curve is now pointing to future economic weakness. That doesn’t necessarily mean recession but further slowing – because the economy has already slowed to below its long term trend – seems likely.
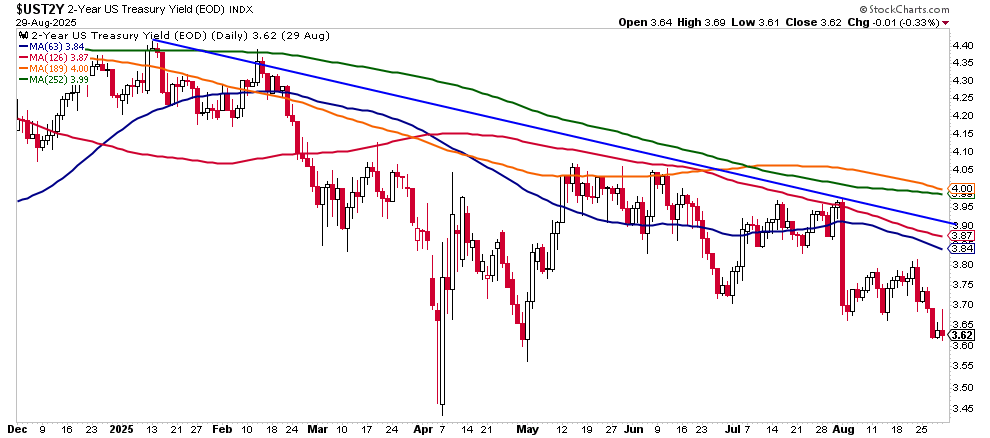
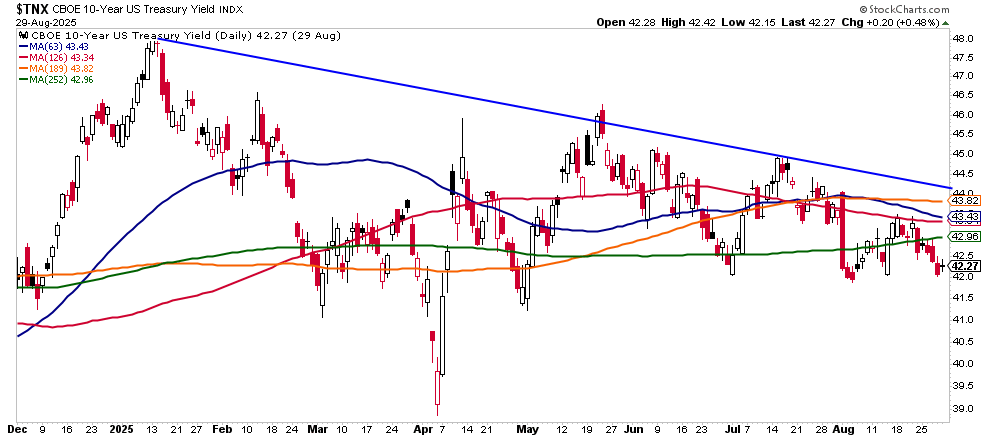
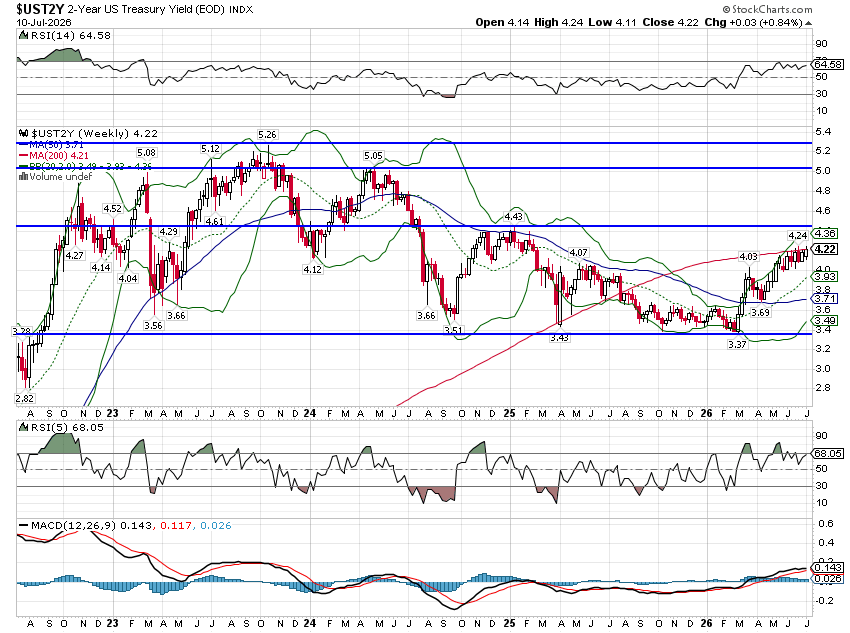
Since January 13th, the 10 year Treasury yield has fallen from 4.8% to 4.22%, a drop of 58 basis points. Over the same period the 2 year Treasury has dropped from 4.39% to 3.62%, a drop of 77 basis points. That is the classic bull steepener associated with past economic slowdowns.
(Click on image to enlarge)
(Click on image to enlarge)
But as I said above, looking at only one curve – and only one time frame – only gets you part of the story. What about some of the other yield curves? The original research done on the yield curve as a recession indicator was done in the 1980s using the 10 year/3 month Treasury spread. When we look at that curve we see something quite interesting. It only uninverted for a short period of time and is presently at zero.
(Click on image to enlarge)
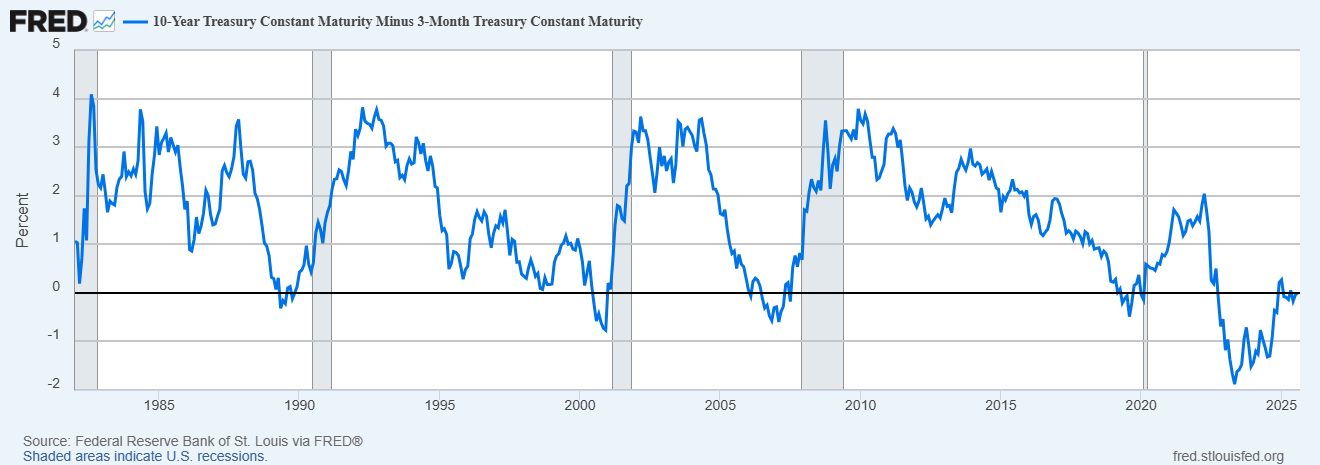
What does that mean? If the 10/2 curve is pointing to weaker future economic growth what does this mean? The 3 month Tbill is the most sensitive to changes in Fed policy so this reflects the current reluctance of the Fed to cut rates due to their fears of inflation. There are plenty of people who are happy to tell you the Fed is behind the curve but I think there may be reason for concern. The PCE inflation report released last week shows that core inflation for July was up 0.26% from June, an annualized rate of 3.3%. The last 3 months annualizes at 3.0% and the year over year change is 2.9%. More concerning, in my opinion, is that the acceleration in core inflation is coming from services not goods; this isn’t about one off prices hikes from tariffs. PCE for services is up 3.6% year over year while PCE for goods is up 1.1% year over year. The rise in goods prices is somewhat hotter than the pre-COVID average but services prices are rising at a pace far above the long term pre-COVID average of 2.5%. The Fed is between the rock of slowing growth and the hard place of still too high inflation.
It isn’t just the yield curve pointing to weaker growth. The personal consumption report for July, released last week shows continuing weakness. Real personal consumption expenditures are up just 0.3% year to date. Real goods consumption is barely higher this year with the annualized rate of spending up just $9 billion year to date. The rate of change for real disposable personal income is also dropping. The year over year change is 1.9% versus the average of 2.5% in the 2010s prior to COVID. Just to be clear, reduced consumption doesn’t lead to economic weakness, reduced consumption is the result of economic weakness. Whatever caused the slowdown in consumption already happened and the source is pretty obvious – the uncertainty created by the Trump administration’s tariff and immigration policies.
I have said repeatedly in these weekly scribblings that I can’t predict the future and I won’t do so here. The yield curve is merely the market’s – the crowd’s – view of the future and it could prove wrong. And while the slowdown in consumption this year can, I think, be credited to tariff uncertainy, the economy was already downshifting prior to Trump’s election. The Chicago Fed National Activity Index has been below zero – indicating below trend growth – for 9 of the last 12 months. I will, however, pat myself on the back just a little. Way back during COVID, when we were spending trillions to soften the blow of the shutdowns, I said that after all the COVID distortions were gone, we’d find ourselves with the same economy but more debt and, therefore, slower growth. That seems to be about where we are today and I suspect we’d be here no matter who occupied the White House.
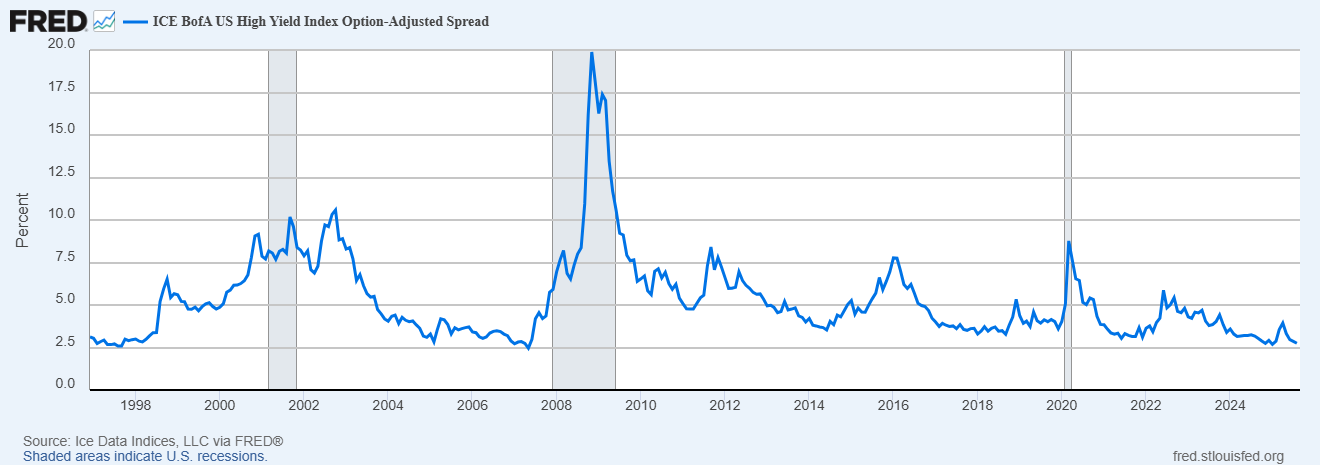
The yield curve is a bit of an outlier right now with no other major market indicators pointing to a slowdown. Credit spreads, for instance, are still near their lows of the cycle and have always been a reliable guide to economic stress. They may be a better pre-recession indicator than the yield curve and right now spreads are not worrisome at all.
(Click on image to enlarge)
The yield curve is flashing a warning but it doesn’t warrant any big changes to your portfolio – yet. In fact, if the Fed does start to cut rates, history suggests that it will be bullish for stocks, at least in the short term. Investors want to believe that Fed rate cuts will allow the economy to avoid recession. It rarely works out that way but hope springs eternal.
The black swan is quiet; it doesn’t announce itself on X or in the pages of the Wall Street Journal. When the yield curve was getting all that attention, it didn’t matter. Now all I hear is the sound of silence.
Environment
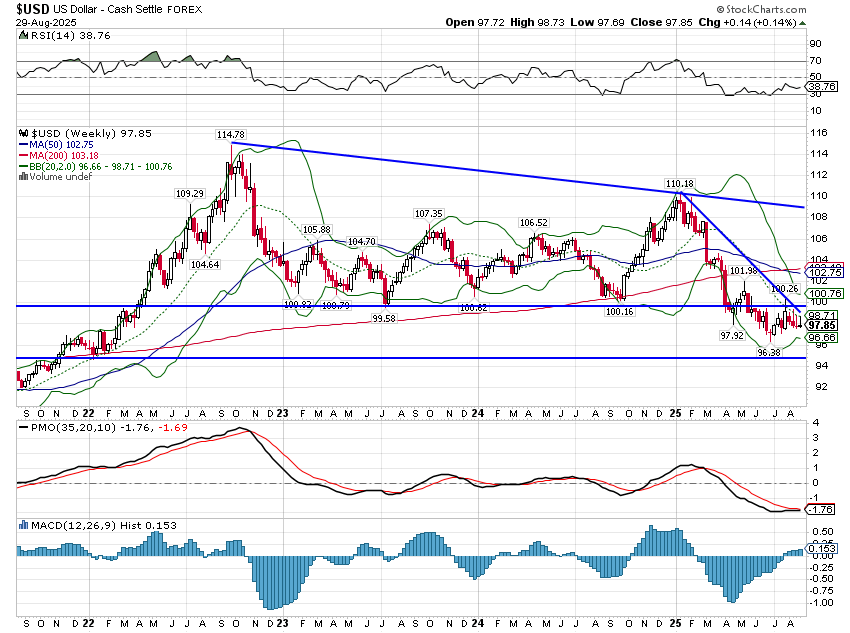
(Click on image to enlarge)

The dollar barely budged last week and the short and intermediate term downtrends haven’t changed. There is still the potential for a rally but its scope would seem limited to around 100, absent any big changes in policy. Could the court ruling on Trump’s tariffs constitute a positive policy change and spur dollar buying? Possibly, but only if the tariffs also are ruled such by the Supreme Court AND if the tariffs are not reimposed under some other executive authority. I don’t know the likelihood of the former but the latter is highly unlikely. The President will use national security as a blanket excuse to do what he wants with tariffs. The only way tariffs ultimately get revoked is if Congress takes action and that is even more unlikely as long as the economy doesn’t tank. For now, I highly doubt that any dollar rally predicated on the removal of tariffs would go very far or last very long.
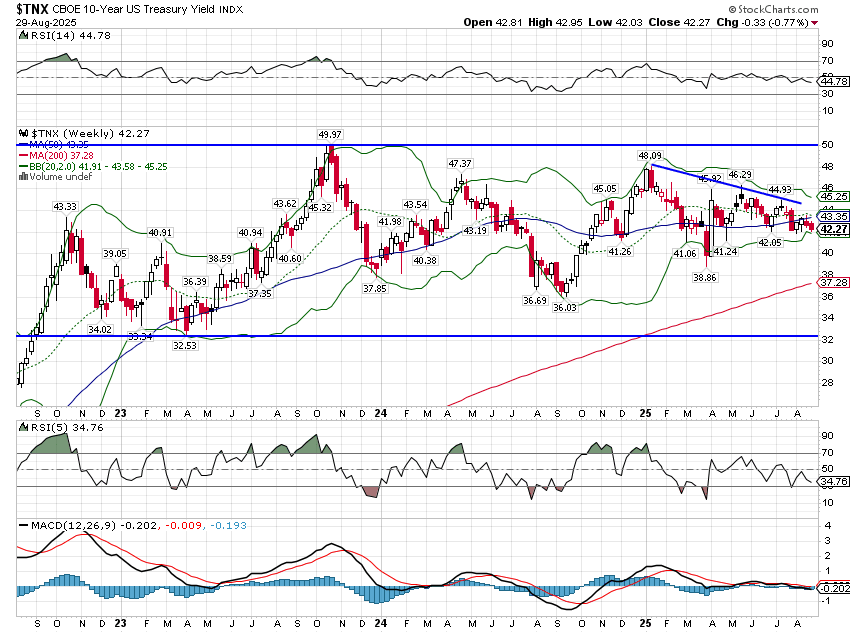
(Click on image to enlarge)
The 10 year yield was down last week but only by about 3 basis points. The 10 year yield is in a short term downtrend that started at the beginning of the year and is still trading in the range its been in for nearly 3 years. That generally means there has been little change in the long term nominal growth outlook, but the key to that sentence is “long term”. Recessions are short term events but long term rates do generally fall leading up to and during recessions; they just react more slowly. That’s why the yield curve tends to steepen right before recession – short term rates fall faster than long term rates. That’s what we’ve been seeing since the beginning of this year but the 2 year yield is still – for now – in that same 3 year range it’s been in.
(Click on image to enlarge)
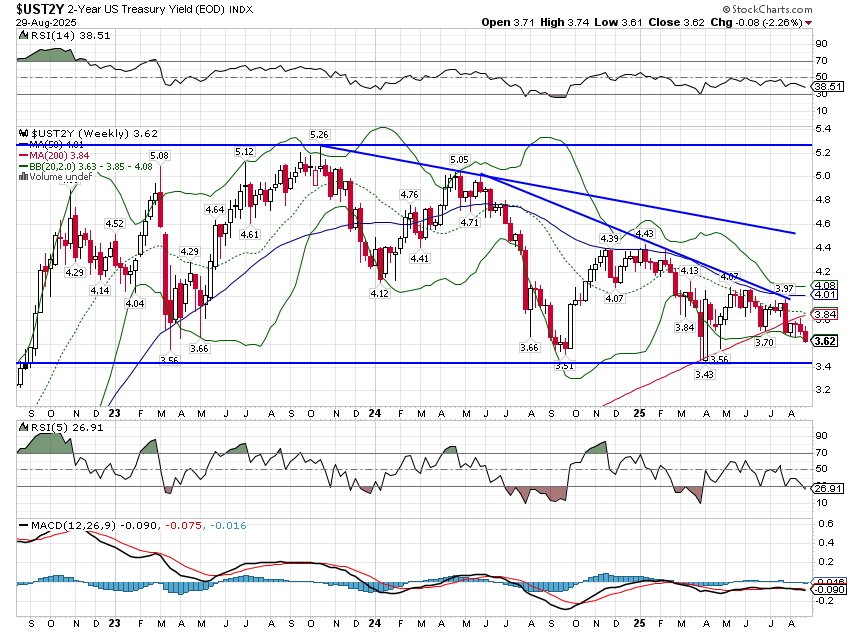
(Click on image to enlarge)
The 10 year/2 year term spread (yield curve) is steepening but not in a good way. A bear steepener, when long term rates rise faster than short term rates, can be positive as it indicates that long term nominal growth expectations are rising. I say “can” because it can also be an indication that long term inflation expectations are rising (NGDP = real growth + inflation). When the curve first started steepening in the summer of 2023, it was a bear steepener and it was positive – inflation expectations were steady as long term rates rose. That was an indication that real growth expectations were rising. But the 10 year rate peaked in the fall of 2023 and the subsequent fall in rates was a combination of lower inflation and real growth expectations. That changed with the rate cut in September last year and the election in November as both started to rise. But since January, the curve has steepened in a bad way, a bull steepener, when short term rates are falling faster than long term. In this case, the drop in rates has been concentrated in real growth expectations as inflation expectations are essentially unchanged.
(Click on image to enlarge)
Markets
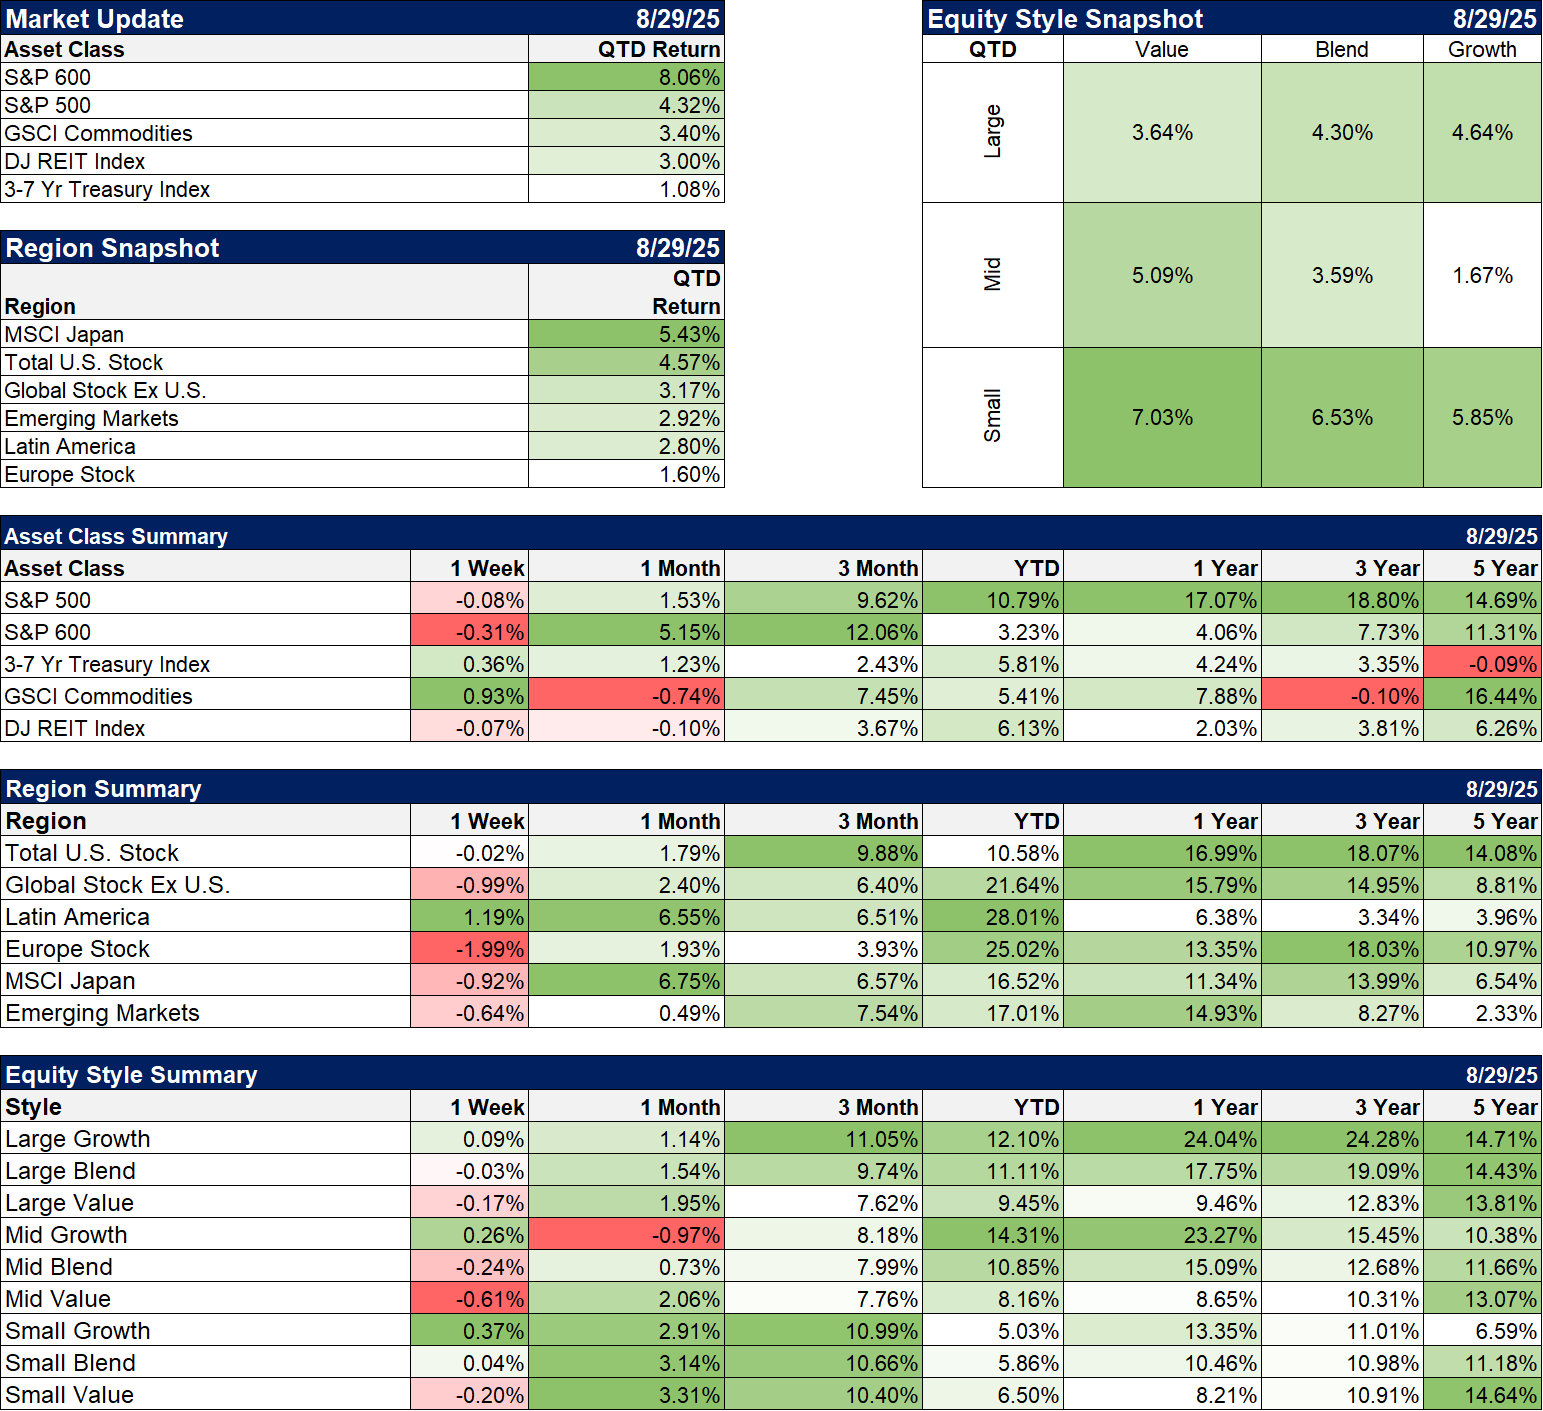
Stocks were mostly lower last week but not significantly. Bonds and commodities, two assets that don’t usually travel together, were both higher. Natural gas was up nearly 12% on the week but is still down 17% ytd. Silver and gold were both up over 2%, copper by about 1.4%, platinum +1% although palladium gave up a little over 1% from it’s recent gains.
In the bond market, while the 10 year and 2 year notes were higher (in price, lower in yield) the 30 year yield rose a bit. While shorter maturity yields have been falling all year, albeit modestly, the very long end is essentially unchanged. That would seem to be a concern over long term inflation but if we head for recession I’d still bet the long end rallies too.
Nothing has changed in the YTD rankings with international stocks beating the US by a wide margin and the S&P 500 beating most everything domestically. The rally has broadened out recently though as small caps have finally come to life. Midcaps, especially the growth category, have done well all year and are neck and neck with the large cap S&P.
(Click on image to enlarge)
Sectors
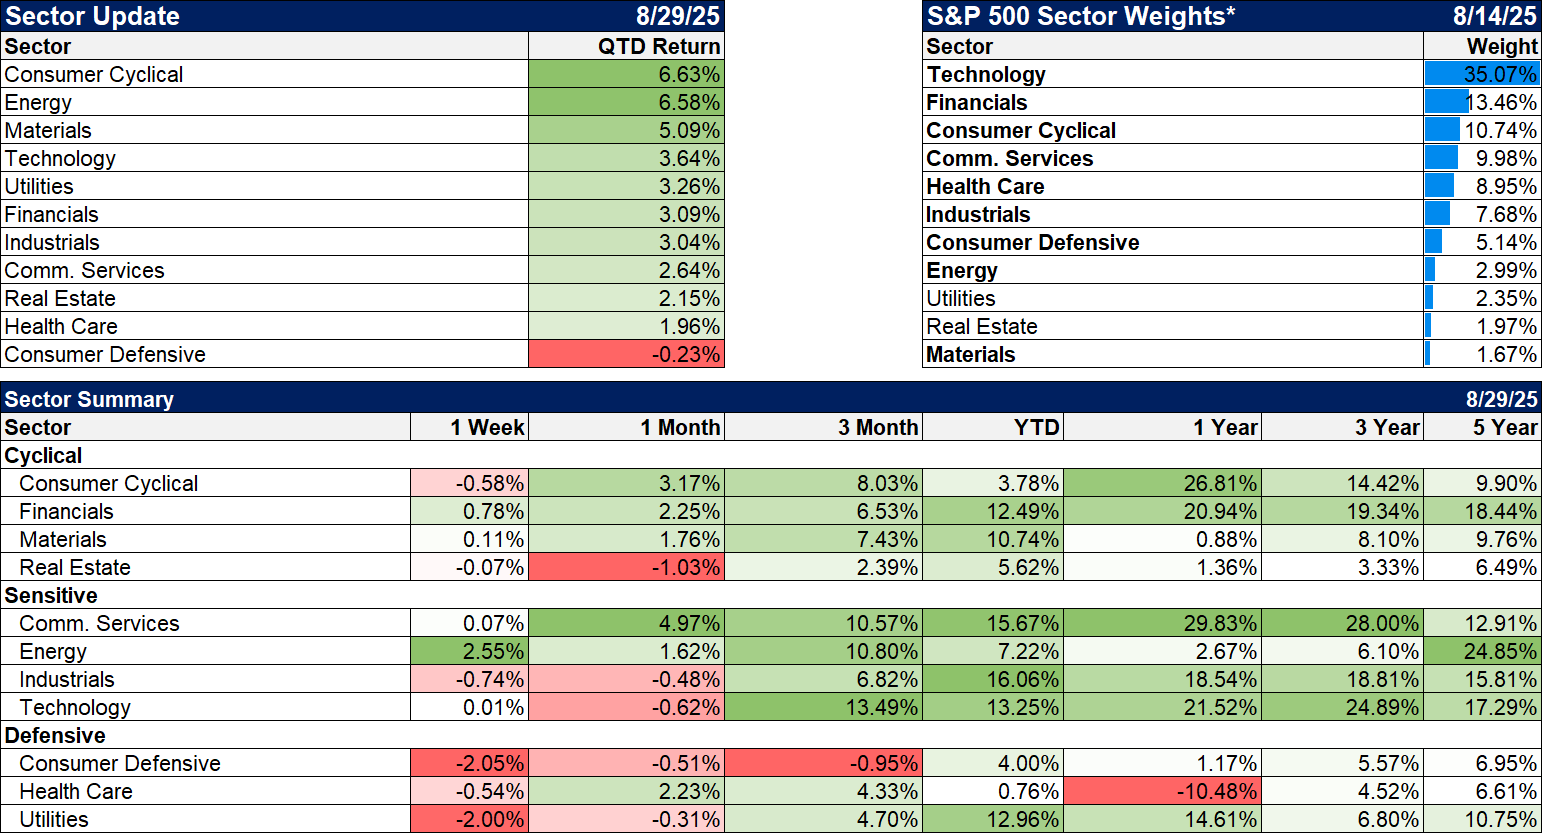
Energy stocks had a very good week with the rally in natgas but the rest of the market was pretty blah. It is interesting that defensive stocks (staples) and utilities were both down over 2%. Utilities have been part of the whole AI rally this year and are quite pricey. I would not expect them to perform as the often do in an economic slowdown, especially if it is led by a drop in AI spending. Staples just continue to struggle with a lot of headwinds from the weight loss drug boom to tariffs.
(Click on image to enlarge)
Economy/Market Indicators
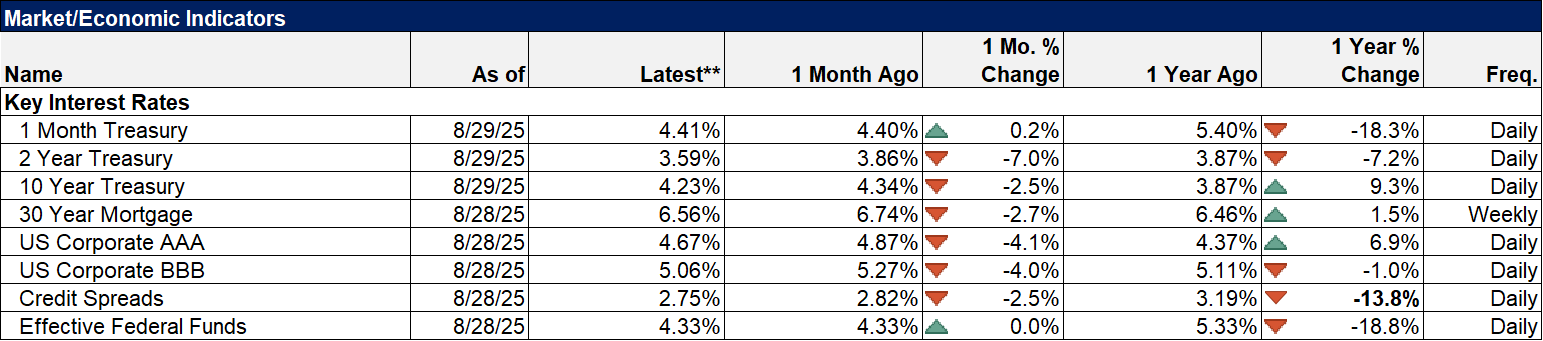
Mortgage rates continue to drift lower with bond yields. The spread to the 10 year Treasury is also drifting lower but is still about 60 basis points above its long term average.
(Click on image to enlarge)
Economy/Economic Data
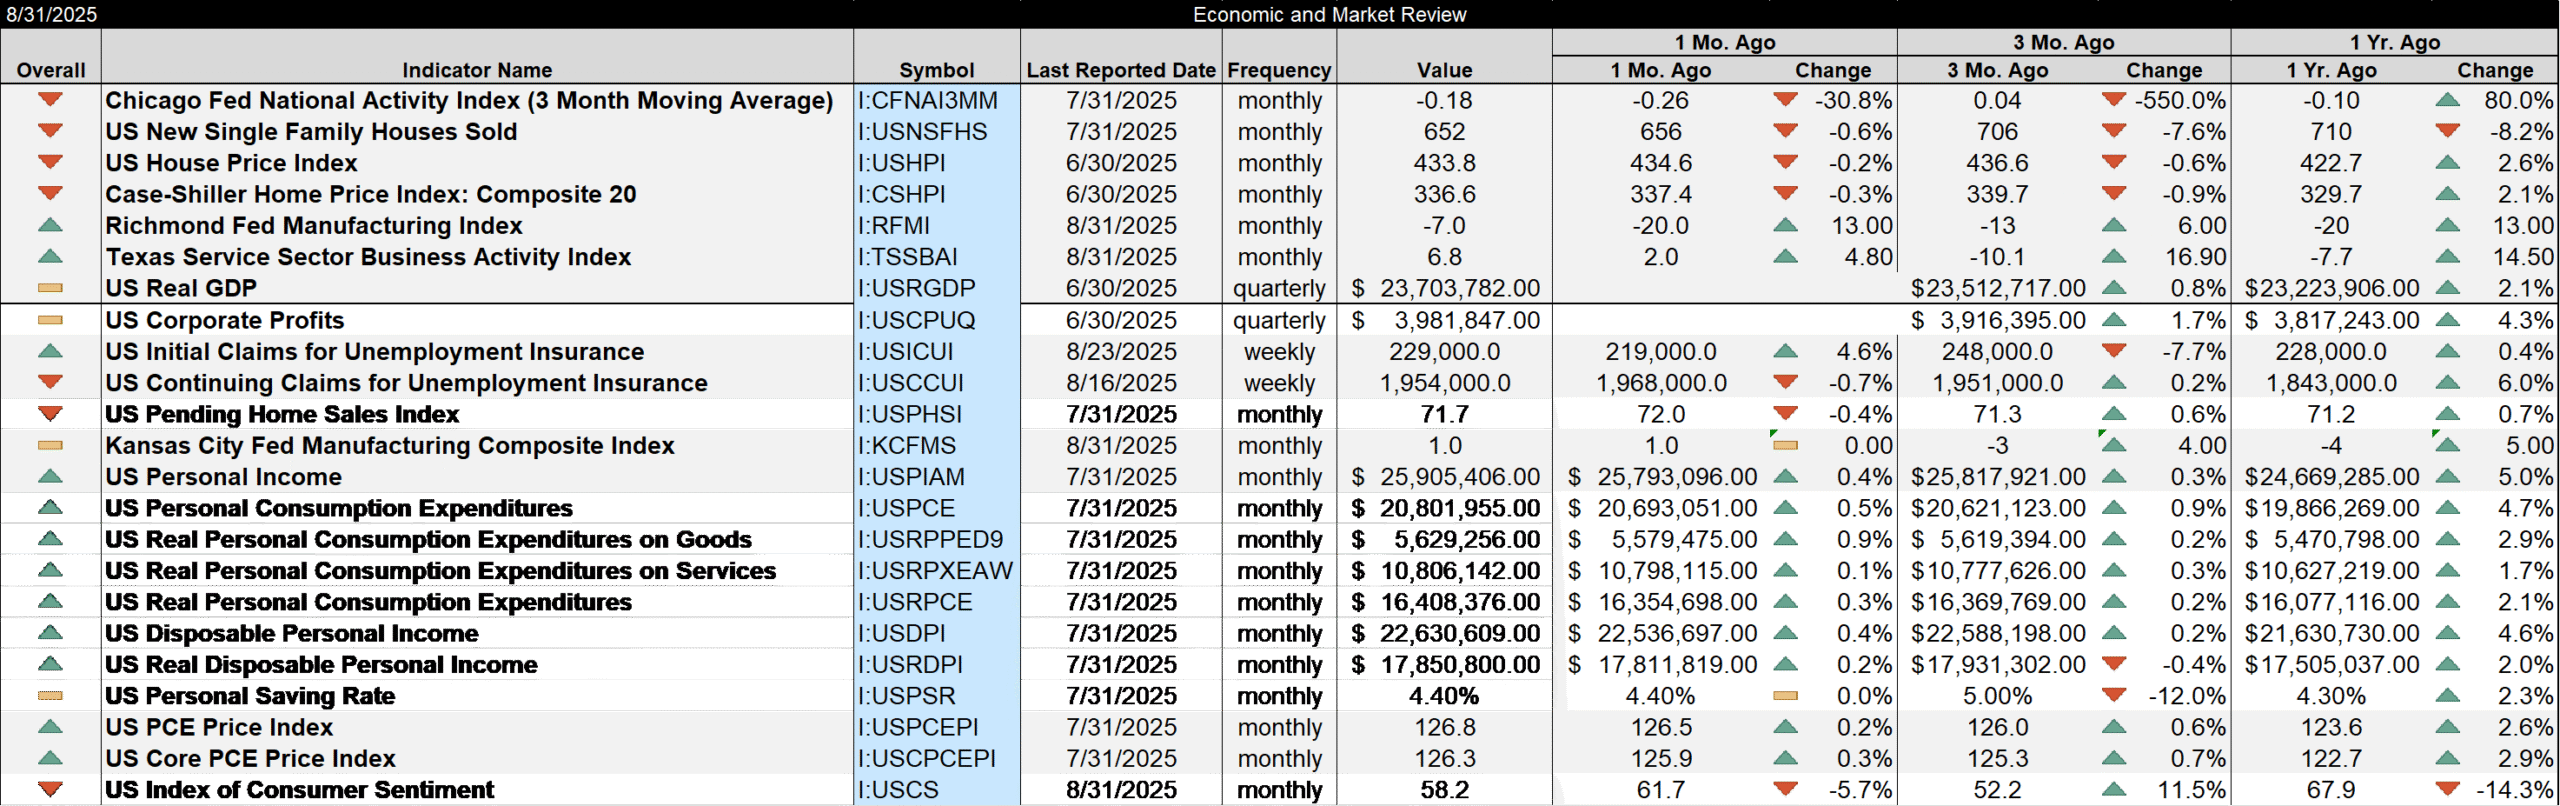
- The Chicago Fed National Activity Index fell slightly to -0.19 from -0.18 last month. The 3 month average (shown below) is now -0.18, below 0 and indicating growth below the long term trend. The CFNAI has been negative for 9 of the last 12 months. Maybe that’s a trend?
- New home sales have stabilized somewhat but are down over 8% in the last year. It is, for the first time in history, now cheaper to buy a new home than an existing home.
- Home prices peaked in March and were down again in June. Prices are up about 2% over the last year.
- The Richmond Fed manufacturing survey improved but remained negative
- The Dallas Fed services index rose to 6.8 and is up from -7.7 a year ago
- GDP was revised to 3.3% annualized versus the initial estimate of 3.0%. The change isn’t enough to move the markets as it is backward looking.
- Corporate profits were up 1.7% quarter to quarter and 4.3% yoy. That’s seems about right with NGDP up 4.6%.
- Still no rise in unemployment claims
- The KC fed manufacturing survey was unchanged but positive at 1
- Personal income and spending both rose, up 0.4% and 0.5% respectively. Consumption has slowed considerably this year with real personal consumption expenditures up just 0.3% ytd. Real goods consumption is barely higher this year with the annualized rate of spending up just $9 billion ytd. The rate of change for real disposable personal income is also dropping. The year over year change is 1.9% versus the average of 2.5% in the 2010s prior to COVID.
- The PCE inflation figures were as expected. It might be impolitic to mention but 2.6% and 2.9% (headline and core yoy figures) are not down to the Fed’s target just yet. Of course, you can’t wait for them to get there before changing policy or you’ll overshoot but frankly a little undershooting would probably be very welcomed by most Americans.
- Consumer sentiment is falling again after a brief bounce from the lows three months ago. I’ve said before that I don’t know what to make of this series anymore because it is so skewed by politics and that hasn’t changed. Historically, it has paid to buy stocks when sentiment is poor but does that apply when stocks are already at an all time high? Damned if I know.
(Click on image to enlarge)
More By This Author:
Weekly Market Pulse: A One-Handed Economist
Weekly Market Pulse: Big Rate Cuts? Not Right Now
Weekly Market Pulse: Trojan Horses


Comments
Log in or sign up to join the conversation.