
'We Have Lift-Off': Yields Lead The Charge Higher; Load Up On Equities, Exit Gold Longs, And Sell US Dollars
Summary
- Looks like sustainable recovery is here after tweet-driven news flow sell-offs. Yields, equities, oil bounced back sharply (and gold, DXY fell). That is collective good tidings to risk assets.
- WTI oil regaining some of former sharp losses. CLc1 now getting its cues from rising yields; gains may not be flash-in-the-pan since geopolitical situation at the Strait of Hormuz worsened.
- Even more propitious for risk assets, yields are leading the charge uphill, which could be the long-awaited echo from recent, massive liquidity infusion from the Fed, Treasury. We have liftoff.
- This uptick in yields likely kicks-off a more sustained risk assets rally. Indications for equities from models are very encouraging. We focus at near-term implications of the High-Frequency model, which suggest that a rally could last until October 30, at least.
- The trilogy of yields, Gold and DXY takes a rare covariance. DXY and Gold are now negatively correlated with yields-- both lag behind yields by 3 days. 10yr yields have likely bottomed and could rise until year-end. DXY and Gold may fall (together) near-term.
Markets took a big hit on US-China trade talk failures by early last week, but the markets proved very resilient. There was a quick and sustained general recovery after the tweet-driven, news flow sell-offs. Yields, equities and oil bounced back quickly (see chart below). That was collective good tidings to risk assets, as it indicated that new positive factors may be at work in the markets.
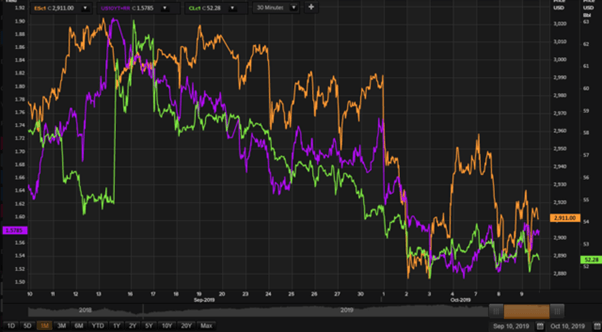
WTI CLc1 regained some of the sharp losses stemming from the sell-off. CLc1 seems to be getting its cues from the yields now, in which case that may be a good thing since yields are leading the charge higher (see chart below). Those gains may not be a flash in the pan since the geopolitical situation at the Strait of Hormuz has worsened, with an Iranian oil-tanker apparently hit with missiles of unknown origin last week.
There has been a good turn in market sentiment, although we still have some ways to go before reaching the sell-off levels from October 7. That is especially true for equities, which were hit the hardest by adverse trade news flow (see chart below). That's why the leadership of bond yields on the charge higher is significant. It will be difficult for risk assets to take off collectively if yields do not rise. That may be particularly true for the depressed equities, which have been severely undercut by negative sentiment.
A quick summation of current market conditions
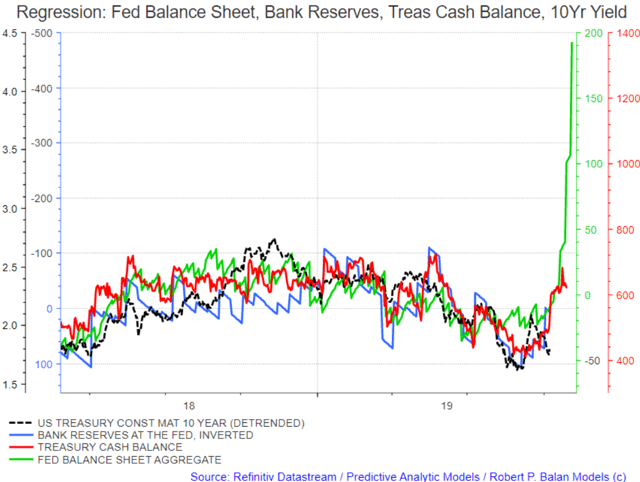
It is an excellent situation for risk assets that bond yields are leading the charge uphill. We may be looking at the initial, positive echoes stemming from the recent, massive liquidity infusions from the Fed and US Treasury. Bond yields are ultra-sensitive to changes in systemic liquidity flows (see chart below). And the recent systemic liquidity inflows have been nothing but phenomenal. We will document in this article that those ongoing inflows could super-charge a forthcoming rise in the prices of risk assets.
Yields, on Thursday last week, broke through resistance levels first, on a day of no positive news flow, indicating to us that the largesse from the Fed and US Treasury may be finally filtering through to the markets' funding dynamics. Liquidity levels always have profound impact on the shadow banking sector's capacity to purchase risk assets. Formerly capital-constrained Primary Dealers have been refueled by the Fed's various (and still ongoing) Temporary Open Market Operations (TOMOs). The Fed's repo operations were frequently oversubscribed, suggesting to us that risk-capital constraints on other major market players were effectively addressed by the Fed as well.
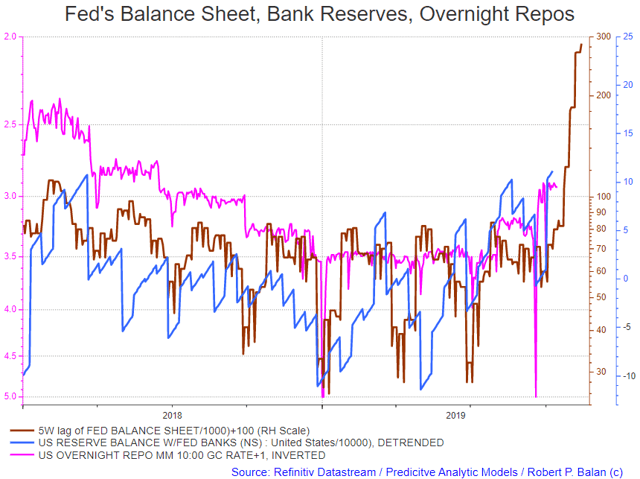
That new supply of money has to go somewhere in search of yield -- that new, risk-capital infusion will likely seek out risk assets, or go out in the form of short-term loans to other players wanting to borrow for eventual purchase of risk assets. The borrowing operations were facilitated by the other positive consequence of ample systemic liquidity -- term (money) market funding costs (the overnight repo rate as proxy) fell significantly lower after the Fed's repo operations added urgently needed bank reserves to the system (see chart below).
As we have illustrated in past articles, liquidity infusions from the Fed and Treasury take a while to percolate through the financial system (from two to five weeks, see chart above, and previous). But once done, the market reaction is quick, and the lagged, positive effect lasts for some time, for as long as the inflows are positive. Rising bond yields manifest the effect of liquidity inflows first, equities follow after a short lag (usually after two to three days), then the rest of the risk-asset universe falls in line thereafter. We believe the process has started.
We have lift-off.
(Details on the timeline of this market "lift-off" is nuanced by a series of intermediate changes in liquidity conditions, and price changes which were discussed in various Seeking Alpha articles and blog contributions. This article is, in fact, a sequel of a Seeking Alpha contribution which was published on September 11, 2019 ("Minor Low Mid Week, Then Equities Rally To Sept. 17-18 Top, Yields Bottom, Gold Tops Out", here), which laid the basic premise of a forthcoming yield lift-off. This article is also a direct update of an October 10 report here. That report, in turn, contained market conclusions which resulted from arguments laid down in the previous day's market report (here).
10yr Yield
As we said earlier, the first sign that the lift-off was on was the break of the resistance levels of the 10yr yield, and the sharp uptick in oil price, on a day with no positive news (see chart below). We were especially on the watch for such price developments because late last week was the optimal period when the liquidity effect starts to kick-in, according to historic, lagged relationship between liquidity infusion and its impact on price.
That yield breakout signaled to us broader, positive implications for all risk assets. Bond professionals are notorious for being circumspect (to the point of being "hard-nosed"). That market is also dominated by institutions, which means that once bond market-makers seize upon a broad market movement, the size and the volume behind their trades are likely to be large and sustained. Our premise was that if, indeed, the bond pros are finally responding to the humongous surge in systemic liquidity (current and future), then yields should rise sharply, and the rest of the risk-asset universe should follow higher thereafter.
Indeed, the market may benefit for some time from the confluence of several positive factors, happening at the same time.
Aside from a tsunami of systemic liquidity from the Fed and Treasury from the repo TOMOs (as described earlier), it also did not hurt that by Thursday, October 10 (when the original article was written), there were already glimmers of hope in the trade situation, with the Chinese trade delegation bringing in "offerings" in the form of huge Chinese purchases of pork and soybeans. We may say that China was writing a check for what they sorely needed anyway, but the new trade talks were propitious for risk assets, nonetheless.
It is hard to beat massive infusion of systemic liquidity, with good trade news topping it up, when it comes to the price of risk assets.
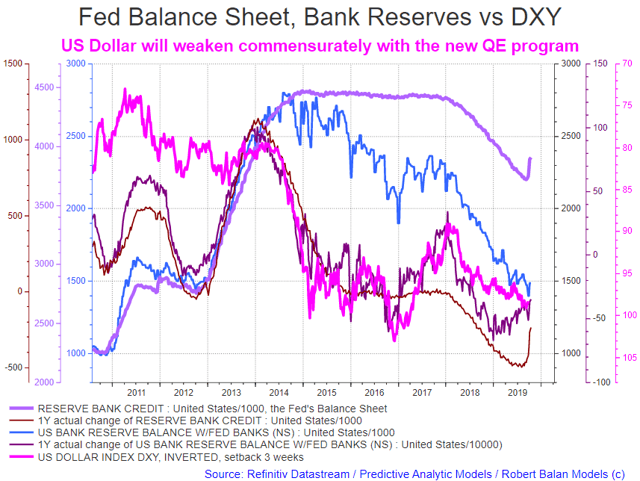
And it does not hurt too that the Fed (at mid-day, October 11) announced a new QE program to the tune of $60 billion a month starting October 15. The rise of the Fed's balance sheet has been primed by the repo TOMOs and retention of the proceeds of expiring securities from the legacy QE program. Now, the balance sheet will be expanded further by a new QE program that pundits call "Not QE." But if it quacks like a duck, and waddles like a duck . . . Talk about piling on good news on top of already good news.
We illustrate the broad impact of rising Fed's balance sheet (and its by-product of rising bank reserves) on risk assets and the US Dollar (DXY as proxy).
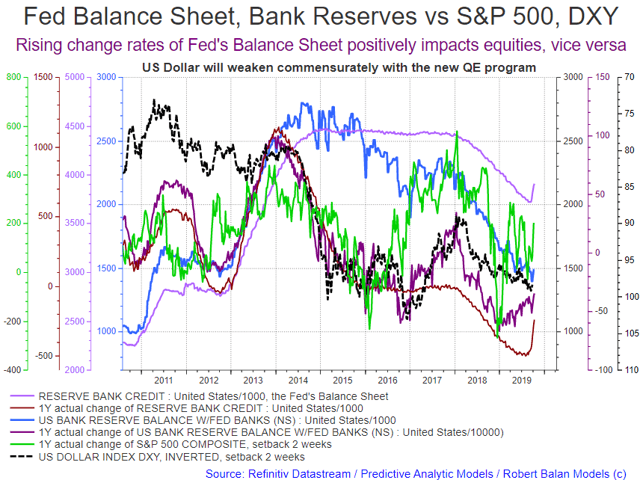
The current (and future) systemic liquidity condition will be phenomenal for risk assets (but deleterious for the domestic currency). It's true that in terms of nominal amounts, the "stealth" Quantitative Easing program being undertaken by the Fed with the TOMOs has not yet reached the level of the prodigious amounts they poured into the system in late 2008 to 2014 (see chart above). However, it is not the nominal amounts (stock) of securities purchases that matter to asset prices -- it is the periodic change rate (flows) that make the difference (see chart above). And now, the "stealth" QE has become overt, the Fed having just announced a new program of $60billion/month purchases of securities from October 15. This new QE program is another thick icing on the liquidity cake.
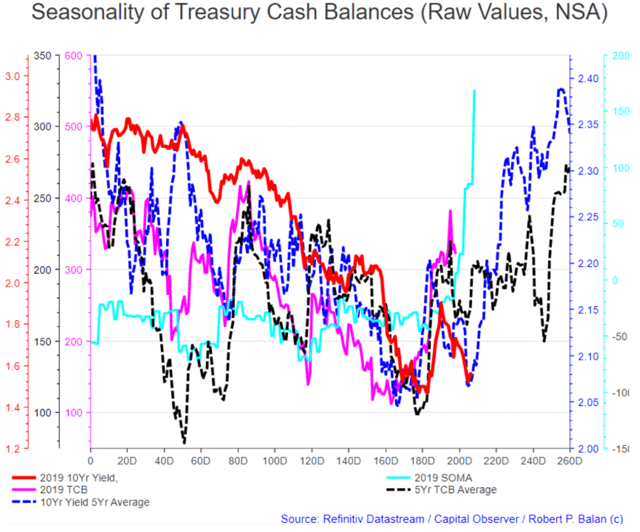
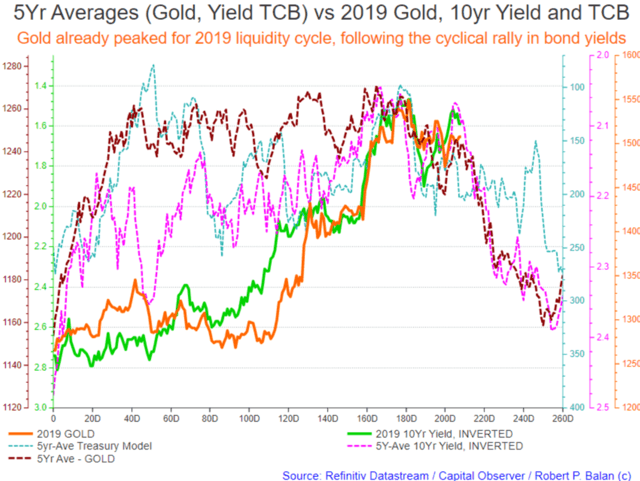
For bond yields, it is changes in the seasonality of the Treasury Cash Balances (TCB) that impacts yields the most (see chart below). The chart illustrates how the five-year average of the 10yr yield (dashed blue line) matches with the five-year average of the TCB (dashed black line). As a refresher, TCB and Bank Reserves are both liabilities in the Fed's balance sheet, but have opposing signs, like yin and yang. When TCB levels rise, the level of bank reserves recede. We have discussed the impact of TCB on yields, and the relationship between TCB and bank reserves in more detail in these two previous articles (here) and (here).
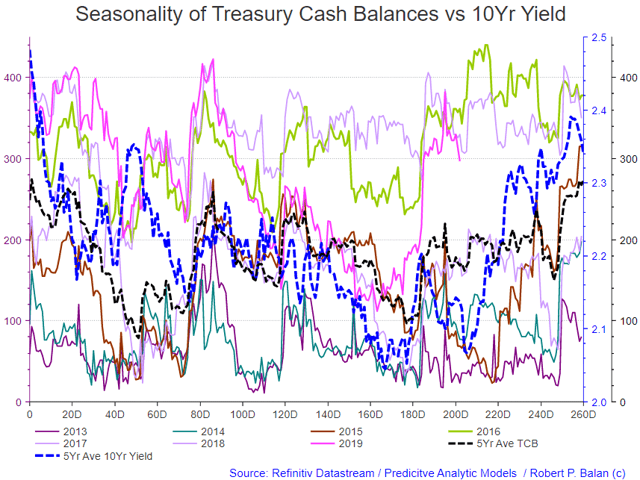
Hence, the 10yr yield bears watching as bellwether for the impact of changes in systemic liquidity. We have modeled the 10yr yield covariance against the seasonal changes of the Treasury Cash Balance. The fit is very good, and it allowed us to call the turn in yields as early as several days ago (see chart below), in line with the projections of the liquidity models (see that report here).
October 8, 2019: bond yields are at the verge of a sharp lift-off:
The PAM liquidity models indeed suggest that this current uptick in yields can be sustained, further out, until year-end (see chart above and below). This is how the same class of model interprets the moves in the yields today (October 10), see chart below.
October 10, 2019: we have lift-off in yields:
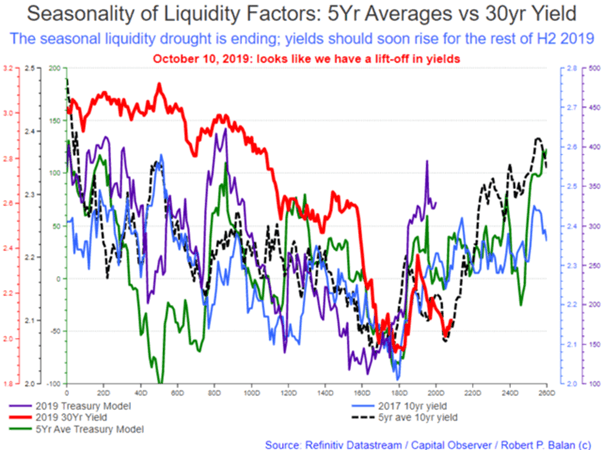
The 5yr average of 10yr yields show that from this juncture in the previous five years at least, yields have always risen sharply until year-end (see chart above) . This suggests that the “lift-off” in yields has legs -- lots of it.
A cyclical bear market in bond has likely began. TBTs and TMVs should do well during the strong take-off phase over the next two to three weeks.
SPX
The indications for equities from the liquidity models are no less graphic (see chart below). The PAM High Frequency (HF) liquidity model suggests that an equity rally from here should be sustainable up to October 30, at the very least. PAM is partial to TQQQs and SPXLs in trading this opportunity.
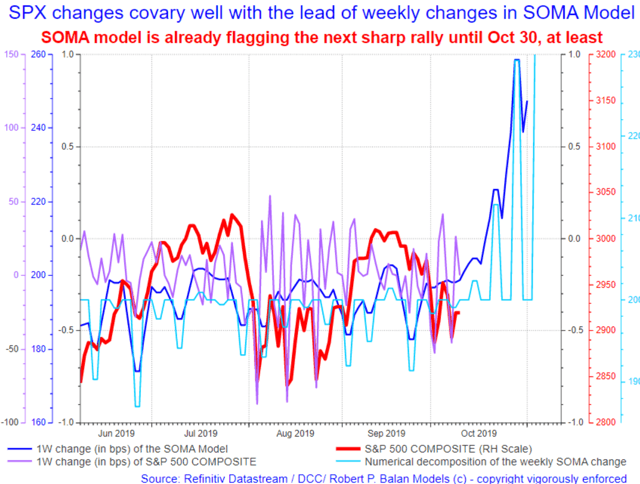
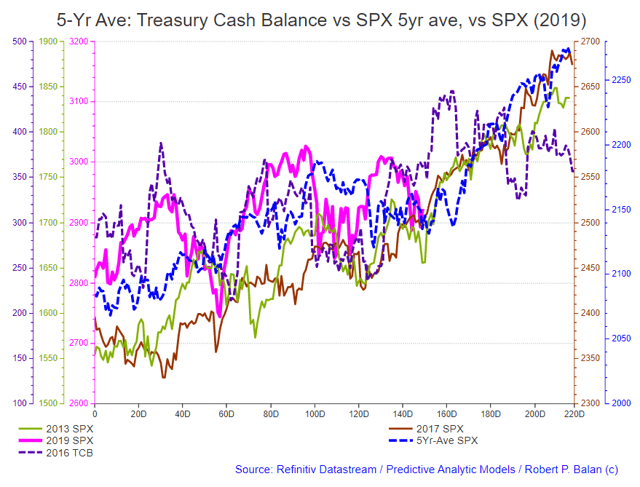
The HF model does not provide a long view, but historical (five-year) averages of the SPX and the models provide a clear outlook that equity markets are at the cusp of a significant rally to come (see chart below). These liquidity models offer the forecast, which is now being validated, that the incipient stock market rally has plentiful legs, too.
We also see that bottoming process taking place at the DCC's SPX front-running model, which I borrow occasionally.
DXY, Gold, Yields
We are starting to see the bottoming theme (in yields and risk assets) across a number of models, including that of gold, a safe haven instrument. The point is that if yields will rise (alongside equities), Gold (as a safe haven destination) should fall, given the mechanistic relationship of the yellow metal to the inverse of yields. Rising yields weaken gold prices, and vice versa.
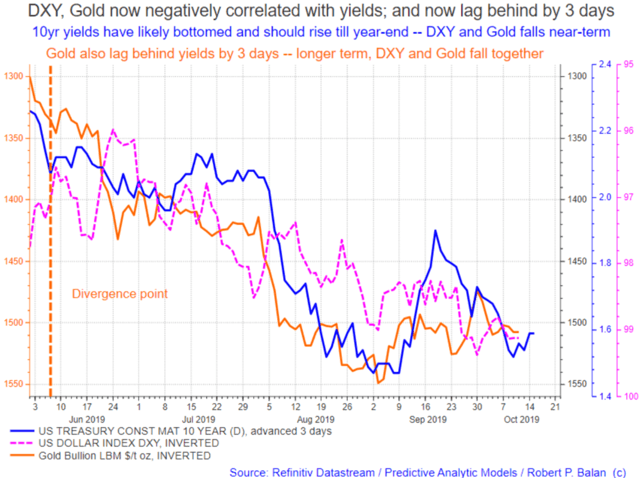
That brings the next focus on the status of the US Dollar (DXY). The trilogy of DXY, yields, and Gold has become very interesting, indeed. DXY and Gold are now negatively correlated with yields; and both lag behind yields by 3 days (see chart below). If we assume that 10yr yields have likely bottomed and may rise until year-end, then DXY and Gold will have to fall (together) in the near-term at least, after a short time lag.
Then there is also the fundamental relationship between the domestic currency and the rising stock of systemic "money," which is governed by the Quantity Theory of Money. This theory posits that rising supply of the underlying lowers the unit value of the currency. That supply of systemic "money" is just about to grow large, very large, and will have negative impact on the US Dollar.
PAM is partial to ULE is expressing our bearish DXY outlook, and DGLD for our gold-bearish sentiment.
Further notes on the trilogy
Gold and DXY may be on cusp of a great sell opportunity, predicated on a sharp repricing upwards of US government yields. The humongous liquidity pouring out of the Fed and US Treasury boosts the price of risk assets, and debases the unit value of the US Dollar, and also removes the allure of Gold and DXY as safe haven destinations.
Since June, the DXY and yields have been on negative covariance. The DXY firms when the yields fall, and vice versa. The DXY has been rallying in the wake of falling yields, as a safe haven asset. But if yields rise, as we expect, then the safe haven trades will unwind, and DXY will fall.
We should make a distinction between the DXY and USD/JPY. If yields rise, USD/JPY will rise (even as DXY falls) because JPY will weaken sharply on safe haven outflows.
Gold should also weaken on safe haven flight from the yellow metal, amid a sharp rise in systemic liquidity, which could forestall the incidence of recession or recession-like conditions. The PAM's positions is that very soon, as soon as we see a take-off in yields, Gold and DXY should weaken together.
Natural Gas
NatGas seems to be developing a buying situation. We believe that NatGas is in at the cusp of a longer-term buy opportunity.
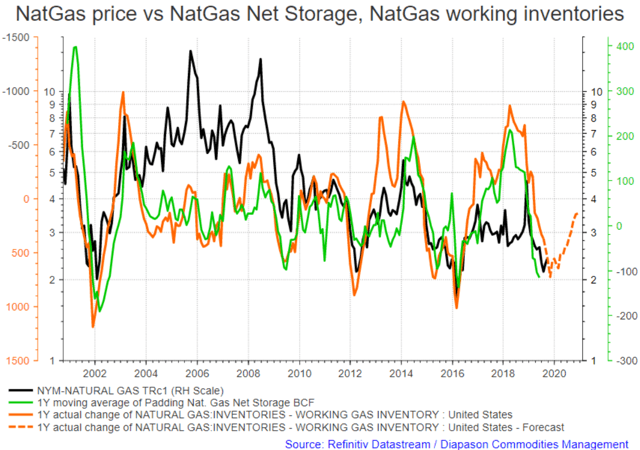
For the immediate term, gas inventory remains significant. But our model suggests that October is the month when inventory build will peak, and start drawing well into late Q1 next year (see chart above).
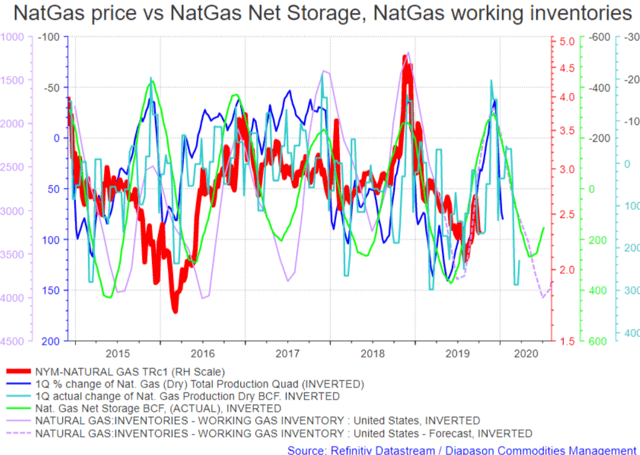
Nonetheless, what impacts NatGas in the long term, is the lagged effect of production. Although production started rising about 4 weeks ago, the impact is lagged (delayed) meaning that the previous decline in production remains a significant prime move of current NatGas prices for the next three months (see chart above). There is indeed a buy opportunity in NatGas probably at current levels of 2.22. We like UGAZ for the first leg in what could be a two- to three-month rally.
Cryptos
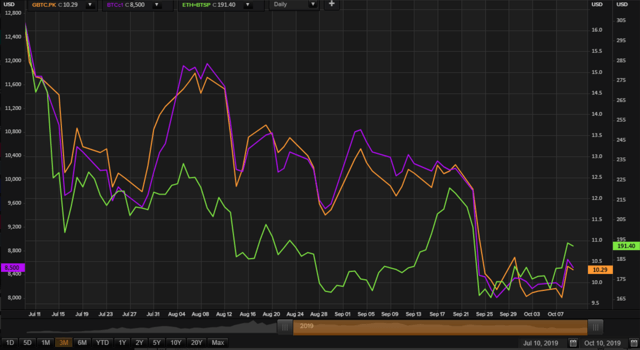
The situation is becoming better and better, but still nothing to write home about yet (see chart above). But we are patient. The long-term outlook for the crypto universe remains good longer-term, the current hiccup, notwithstanding. The positive impact from China liquidity flows should sustain the crypto universe until mid-2020 at least. (see chart below).
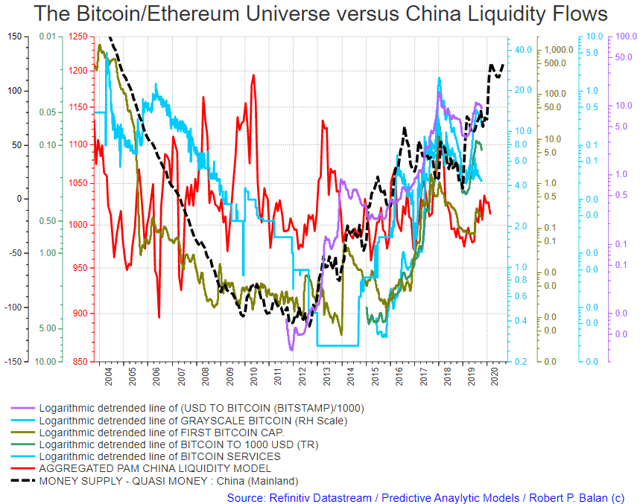
We are partial to GBTC, BTC and ETH in long crypto trades.
I am/we are long equities, oil, euro. I wrote this article myself, and it expresses my own opinions. I am not receiving compensation for it. I have no business relationship with any ...
more


It depends on how fast long yields rise. Collateral issues connected with fast rising yields could cause market selloffs to meet margin calls.
Thanks for the comments Gary. In this case, rising yields are associated with rising bank reserves, so that means funding costs (term market rates, e,g, repo) will still be falling. It is easy and cheap enough to get funding from the term (money) market without resorting to margin calls.
Hey Robert. Two things. First, I don't get the connection between rising reserves and funding costs because we are told that excess reserves cannot be loaned out. I suppose the interest on excess reserves can be. But Jamie Dimon warned in another period of time where interest on reserves were in place, that a fast rise in rates could hurt the banking system. What if treasuries, the collateral of choice in derivatives markets, lose too much value too quickly?
static.seekingalpha.com/.../...709487453983986.png
Repo rates go up when bank reserves fall because the reserves are being used as collateral in inter-bank lending. See the chart provided above. The reserves are not being lent out. Having little collateral is just like raising rates, and usually that is what happens with the dearth of collateral.
That depends on the context of what Dimon was saying, Rising rates USUALLY steepen the yield curve, and that helps the loan portfolios of banks, not hurt them. You understand of course that banks borrow short and the lend long, so rising rates improves their Bet Interest Margin income.
#What if treasuries, the collateral of choice in derivatives markets, lose too much value too quickly#
Just what hypothetical case of how much yield rise are you talking about and in what time frame? Of course for your fears to be realized the rise in yields, to be disastrous, have to really very high and very rapid. The 10 yr yield fell from the 8 November top of 3.3 to a low of 1.47 in less than a year, but the stock market went to new highs. One can always invoke hypothetical cases. but how realistic is your scenario? Its hard to argue against hypothetical cases because they have never happened. Give me a concrete situation, instead of a hypothetical question, otherwise we will be debating this issue for some time.
Great answer. But there were massive pur hases of treasuries as yields declined. Those are often used as collateral. The counterparty margin losses could be massive if rates rise too quickly, but I cannot give a time frame regarding how much time would elapse or how fast the rise in rates would be before it is a danger.