

Image Source: Pixabay
Sterling Strategic Bond allows investors, should they wish, to outsource the bond portion of their portfolios to one manager. If you don’t fancy the prospect of deciding whether to be long or short duration (a bond portfolio’s sensitivity to interest rate changes), where to be positioned between government, corporate investment grade or high yield debt, local currency or hard currency in emerging markets, or whether to be in emerging markets at all—well, this could be the solution.
It is certainly a volatile market. Interest rate expectations over the past year are a case in point, with consensus changing on the number and speed of cuts from major central banks with dizzying rapidity.
Last year came to a tumultuous end for fixed income investors, as December saw a bond sell off, as investors took fright at the combination of sticker inflation reinforced by the threat of tariffs and trade wars—the effects of which themselves will likely be inflationary. Nevertheless, as they year turned, US growth expectations remained robust, with the IMF revising its estimation for the world’s largest economy up. Inflation remained above target, stopping the Fed from cutting rates further in January. In the eurozone, the economies of Germany and France contracted over the fourth quarter of last year, while over the channel, the UK too struggled with sluggish growth and persistent inflation, with January figures rising to 3%, before dipping back to 2.8% in February.
That was still the case when I wrote this piece for Moneyfacts. In the intervening few short weeks, US expectations have nosedived, and investors are finding causes for optimism on this hitherto less fashionable side of the Atlantic.
All of which present challenges for bond investors. It has been the most popular asset class since the spiking rates caused bond valuations to tumble in 2022. Yields increased from the meagre offerings that characterised the period between the global financial crisis and Covid, attracting a wave of cash.
Of all the Investment Association sectors, Sterling Strategic Bond has been the largest beneficiary of this money, pulling in £12.83bn in net flows over last year, beaten only by North America (£40.32bn) and Global (£34.45bn).
Has this paid off for those that have entrusted their capital to the sector’s managers—have they mixed the optimal cocktail of fixed income securities? Looking across the annualised returns of 13 IA global, sterling, and US dollar sectors, Strat Bond was fifth from top last year, and third from the top in 2023. In the crunch year of 2022, it was fourth from the bottom, losing 9.96%—albeit well ahead of Sterling Corporate Bond, UK Gilts, and UK Index Linked Gilts, the latter falling by £36.22%.
Over 20 years, the sector ranks sixth out of 13 in terms of average annualised returns. Unsurprisingly, high yield sectors beat Strat Bond, having a greater correlation to equities. Less intuitively, USD Corporate Bond and Global Corporate Bond also come out ahead over the period.
Three-year returns till end-January average 3.56%. That’s more than two percentage points below the one-year return because of the strongly negative 2022. The range of fund returns over the period, however, varies greatly (from 17.99% to -23.96%).
There has been a fair amount of shuffling of the top-10 table since we last surveyed this sector a year ago, with seven new entrants. Two of these have a short-duration mandate, meaning that they will have been less subject to capital loss as rates rose three years ago. That positioning may not provide such a tailwind over the coming period, though given out febrile geopolitics it would be rash to write it off completely.
The three funds that clung on in the table over the year are Royal London Sterling Extra Yield Bond (which returned the 17.99%), PIMCO GIS Income, and Mirabaud – Sustainable Global Strategic Bond. It’s a safe bet (on this if nothing else) that staying the course over the next 12 months will require no little skill.
Table 1: Top-Performing Sterling Strategic Bond Over Three Years (with a minimum five-year history)
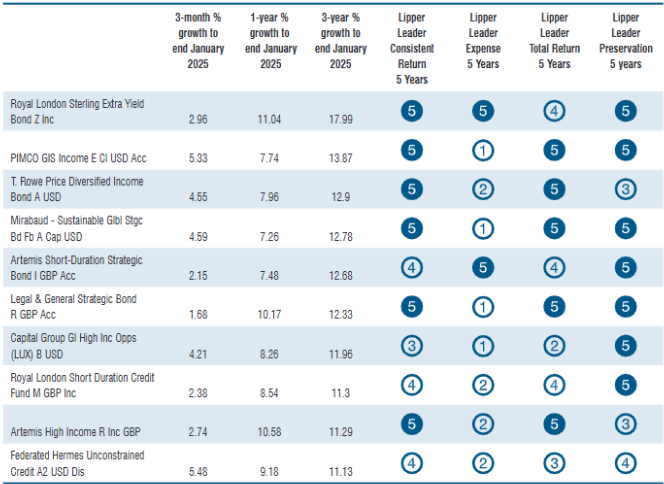
All data as of January 31, 2025; Calculations in GBP
Source: LSEG Lipper
More By This Author:
Review Of Market Concentration in the European ETF Industry At The Classification LevelSpotlight On Promoter Concentration In The European ETF Industry
S&P 500 Earnings Dashboard 24Q4 - Friday, March 28


Comments
Log in or sign up to join the conversation.