

Image Source: Unsplash
The market has been really choppy and difficult to read lately, so I am uncertain on how to define the short-term trend for the market at the moment. However, based on the PMO index shown below, which is pointing decisively lower, the majority of stocks have lost their short-term upside momentum.

Here is an interesting chart that I think confirms the chart of the PMO index shown above.
This is a chart of the SPX advance/decline line momentum, which is shown by using the Martin Pring KST indicator, and the SPX is overlaid on the chart (the advance/decline line is not shown). I like the KST because it remains smooth, providing clear signals.
At the moment, this indicator looks like it is starting to roll over. This seems to suggest one should consider taking partial profits and raising some cash before the market begins its next short-term downtrend.
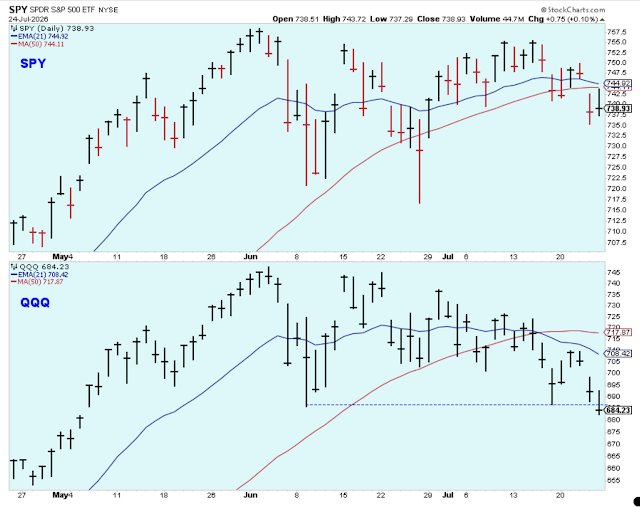
If you look at the most recent couple weeks of the SPX, it has been very choppy, as it shows a strong rally into mid-June, then a sharp pullback, then a strong gap up, and then a gap down. That kind of behavior looks like a short-term top to me, which I think is confirmed by the momentum indicator.
In other words, this chart is saying that the market remains in a short-term uptrend, but the next short-term downtrend is getting close. And, as you may know, I believe in raising cash near the short-term peaks in order to be able to take advantage of better prices in the weeks ahead.

The chart of the junk bond ETF has been rising nicely for months, and it has been telling me to remain optimistic about rising stock prices. Now, it is testing its own uptrend line, which means it is important to watch this chart every day. If it breaks down, it won't be the end of the world, but it would at least mean to increase my level of caution a bit.
On the hand, I also think it is quite possible that this ETF will crawl higher along this uptrend line. If that is the case, then I will continue to buy stocks on the dips, and for me, this means that I will buy stocks near the lows of the short-term downtrends.

Bottom Line
I am about 80% long stocks and I will decrease the percentage of stocks by taking partial profits. Alternatively, when the short-term downtrend is confirmed, I will get stopped out of individual stocks as they generate sell signals.
On Wednesday and Thursday, after the dramatic news from ADP that there were a half million new hires in the private sector, Treasury Bond yields popped way up and past the highs of early March. This caused a lot of turbulence in the stock market on these two days as higher yields pushed down stock prices. But the muted employment numbers in the Friday non-farm payrolls calmed the bond market and allowed stock prices to stabilize.
So, now what? So far, it looks to me like the sideways behavior of bond yields will continue because this appears to be just a test of the upper range, and I believe yields will back off a bit in the weeks ahead. But, I think you will have to continue to watch this chart every day, as if yields do decide to move higher, it is very likely that stock prices will suffer.

Outlook Summary
- The short-term trend is uncertain for stock prices.
- The economy is at risk of recession as of March 2022.
- The medium-term trend is uncertain for Treasury bond prices as of Feb. 4.
More By This Author:
The Short-Term Uptrend Continues As Things Get Interesting
Friday May Have Started A New Short-Term Uptrend
Uncertainty In An Uncertain Market


Comments
Log in or sign up to join the conversation.