
(Click on image to enlarge)

Treasury yields from the New York Fed, chart by Mish
A relentless rise in US Treasury yields is underway, but the result is not a steeper yield curve. This is a “bearish flattener” not a “bearish steepener”
Steepening occurs when the difference between short- and long-term yields increases. Flattening occurs when the difference between short- and long-term yields decreases.
Direction Synopsis
- Bullish Flatterer: Falling yields but a flatter curve
- Bullish Steepener: Falling yields in a steeper sloping curve
- Bearish Steepener: Rising yields in steeper sloping curve
- Bearish Flattener: Rising yields in a flatter curve
A bearish flattener is generally a bad environment for equities but stocks bucked that normal behavior for many months.
$SPX S&P 500 Daily Chart
(Click on image to enlarge)

$SPX S&P 500 Index courtesy of StockCharts.Com, annotations by Mish.
Here is an amusing headline from earlier today: Wall Street Declines on Middle East Conflict.
Stocks are significantly higher now.
Expect the next headline from the same place to look something like this: Wall Street Rises on Middle East Conflict.
Gold is up and the dollar is up despite gold being up. Oil is up, and stock are up. So everything appears rosy at this instant.
Treasury Yields May 2022 to October 2023
(Click on image to enlarge)

Treasury yields from the New York Fed, chart by Mish
Since May of 2022, the 3-month yield rose from 0.85 percent to 5.63 percent. The curve flattened, then steeply inverted, and is now getting flatter again.
Treasury Yield Spreads January 2022 to October 2023
(Click on image to enlarge)
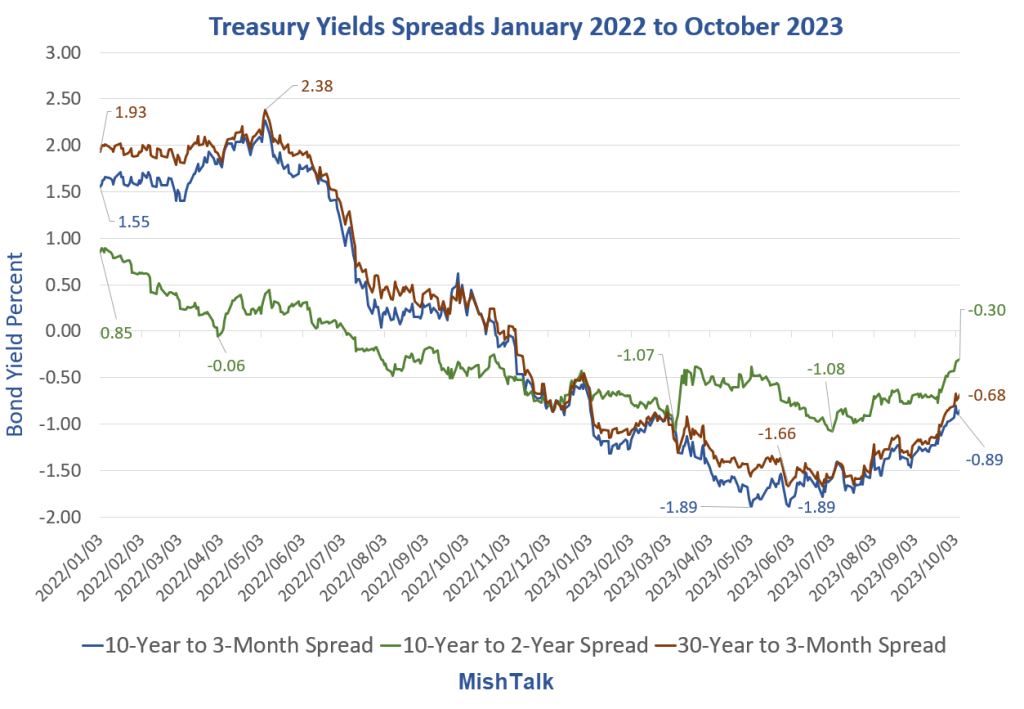
Treasury yields from the New York Fed, spread calculation and chart by Mish
Inversion Flattens
- At the point of maximum inversion the 10-year to 2-year spread was -1.08 Percentage Points (PP). It’s now -0.30 PP.
- At the point of maximum inversion the 10-year to 3-month spread was -1.89 Percentage Points (PP). It’s now -0.89 PP.
- At the point of maximum inversion the 30-year to 3-month spread was -1.66 Percentage Points (PP). It’s now -0.68 PP.
This is massive flattening, not steepening. But it does represent a steep rise in yields.
Why?
This behavior seems to indicate a stagflationary environment, inflation plus a recession.
Alternatively, it represents a preference change, an increasing desire to hold shorter maturities.
It could be both.
Why hold 10-year treasuries yielding 4.8 percent when when you can get a risk-free return of 5.63 percent on 3-month treasuries?
What About Dumping?
Someone has to hold every treasury 100% of the time, so aggregate dumping is mathematically impossible.
Rather, people (in aggregate) now demand a higher yield for the added risk of buying a 10-year note.
But in return for that risk, there will be capital gains if yields at the long end decline for whatever reason.
I strongly prefer holding 10-year treasuries to the S&P 500. But you don’t have to do anything. Short-term treasuries are a buy for those seeking to avoid as much risk as possible.
Bond Bulls are Getting Crushed in a Relentless Selloff, It’s Not China
For rebuttal to the widespread belief that China is dumping Treasuries, please see Bond Bulls are Getting Crushed in a Relentless Selloff, It’s Not China
Meanwhile, Mortgage rates are at a 22-Year High and Headed Towards Eight Percent
Eight percent mortgages will further destroy the housing market. Please thank the Fed for this outcome.
For further discussion, please see How the Fed Destroyed the Housing Market and Created Inflation in Pictures
Individuals have a choice, but in aggregate there is no choice. Mathematically, someone must ride stocks and bonds to oblivion (or the stratosphere) if that is the direction.
More By This Author:
Here Comes The Big Push For More Money For Ukraine And Israel
Stunning Drop In Consumer Credit Due To Student Debt Repayments, What’s Next?
How Did The Surprisingly Strong Jobs Report Impact Rate Hike Odds?


Comments
Log in or sign up to join the conversation.