Time To Buy?
It’s pretty rough out there in financial markets. Stocks are still falling, notwithstanding the odd counter-rally here and there, and yields are still rising, leaving investors with little in the way of a place to hide. I think it is relatively simple to explain what’s going on, in general terms. Before the pandemic, markets were propelled higher by low inflation, low bond yields, and plenty of monetary accommodation. Running the economy hot was not just relatively cheap—in terms of the classic trade-off between stocking growth and employment and inflation - it was the right thing to do. I mean, you wouldn’t want unemployment to rise, would you? The initial roaring rebound in markets from the initial Covid shock in spring 2020, promised a quick return to “normal”. It didn’t last.
Our response to the pandemic left the global economy with too much demand relative to a bruised supply side. The stubborn zero-Covid policy in China and the war in Ukraine have added insult to injury on this account. The latter is particularly painful in light of the politically-driven supply-side destruction from effectively shutting Russia out of the global economy.
On the face of it, this sounds like a case of bad luck. Maybe it is, in part. But it is difficult to escape the reality that policymakers, and economic commentators, became too wedded to the idea that if you just pushed hard enough on the demand side, both via fiscal and monetary stimulus, supply would materialize on its own.
This is naïve in the extreme— as I have argued on many occasions—and the chickens are now coming home to roost. We have gone from a world in which below-target inflation allowed central banks to keep rates low, and even in some cases to pursue open-ended QE policies, to a world in which inflation is rising and threats to growth are mounting. This is not the stagflation of the 1970s, but the similarities are close enough to merit some thought. It also shows why central banks and governments now find themselves in a terribly difficult bind.
The story above invites two questions. First, bearing in mind that the shift in the macro regime described above has been painful for financial markets, is now the time to buy, regardless of whether the shift is more sustained. Second, should investors now get used to a world of higher inflation, and presumably, higher bond yields, and if so, what does this mean?
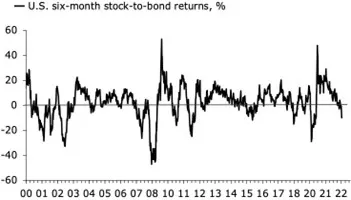
Timing tops and bottoms in markets are difficult, if not impossible on a consistent basis. That said, I am seeing more than a few researchers and commentators putting their name behind the idea of a tradable, perhaps even an “investable”, bottom. When Gina Martin Adam sticks her neck out, I am inclined to listen. There are 100s of market-timing indicators, all of which suffer from the same flaw. They work, but only sometimes, and it’s impossible to know ex-ante which ones will work, this time. I tend to look at one, in particular, the stock-to-bond ratio. The first chart below shows that ratio on a six-month basis for the S&P 500 and the US 10y note. It’s looking soggy, but it is not an extreme, yet.
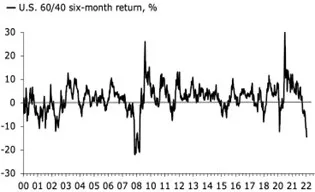
fig. 01 / Not a bottom, yet - fig. 02 /This looks like a buy


But, I hear you say, isn’t the whole point at the moment that stocks and bonds have sold off together? It is, I guess. That said, the six-month stock-to-bond ratio has a stationary trend, indicating that it is impervious to shifts in the correlation between stocks and bonds.
My second chart, however, captures the idea that both stocks and bonds have suffered. It points to a much tastier setup. In short, the otherwise unassailable 60/40 portfolio has been crushed this year, to such an extent that only the collapse in 2008/09 is worse, based on data from 2000.
Looking at this chart alone, investors should rush to buy both stocks and bonds. Remember, however, that it matters which leg drives the rebound if any. A sharp rally in bonds would offer some relief, but not necessarily for a 60/40 portfolio if it occurred in the context of a further collapse in stock prices.
Leaving the near-term fate of markets aside, how should investors think about inflation? I think it’s worthwhile remembering Fitzgerald’s definition of first-rate intelligence. It’s possible that we will look back on today in 12 months’ time wondering what all the fuss over higher inflation was about in the first place. But even if inflation comes down, and I am sure it will, I suspect investors will have seen enough to consider whether a more durable long-term inflation-proof strategy is warranted.
The suggestion covered extensively here and in many other places is to buy value over growth in equities. This is a strategy that has worked well so far this year, relatively speaking, but what is the problem for equities when inflation shifts to a permanently higher state?
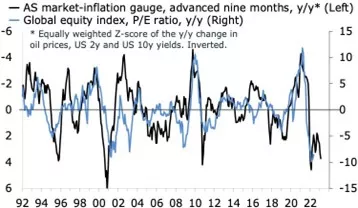
In a nutshell, equities tend to trade at lower (nominal) multiples in periods of higher inflation. My next two charts attempt to capture this theme. The first links cyclical shifts in inflation pressures with shifts in valuations. It shows that shifts in oil prices and bond yields tend to drive shifts in P/E multiples with a lag of nine months. At the moment, my in-house points to further pressure on multiples in the near term. Indeed, the weight on multiples in this framework has never been stronger and more sustained, based on data going back to 1992.
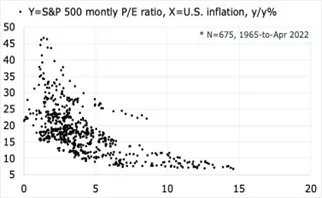
The second chart below shows my recreation of a chart that you can find in several versions online by googling “inflation and equity valuations.” It plots the relationship between the P/E multiple on the S&P 500 and US inflation with monthly observations going back to 1965. I have cut the Y-axis to avoid the outliers, which usually makes this relationship look much better than it is.
fig. 03 / Still no upside for multiples? - fig. 04 / A new regime?


Still, the message from this chart is straightforward. At inflation levels above 6%, P/E multiples tend to be pinned below 15. Below that the curve steepens gradually, al- lowing for the highest multiples when inflation is closing in on 2%. With inflation between 4 and 6%, we shouldn’t expect P/E multiples consistently above 20.
I’d predict two objections to this framework. First, the P/E is only one valuation metric, and not necessarily the best
one. Secondly, the P/E multiple on the market as a whole is a misleading indicator during shifts in macro regimes, because such shifts tend to be linked with shifts in sector leadership. I concur, though I also think this is covered by the now-well advertised suggestion to buy value overgrowth as inflation rises and bond yields shift higher.
The question remains, however, whether market multiples can shift in the transition in leadership from low inflation/high P/E stocks to high inflation/low P/E stocks. After all, transitions are not a one-way street and this matters for the increasing share of investors and asset allocators exposed to beta. Third and finally, can’t firms just outearn a falling multiple? After all, earnings are nominal and if inflation is rising, won’t that give listed firms pricing power? I think the answer to this question is that it will, in some instances, bring us back to the discussion about a rotation in sector leadership.
I’ll leave readers with the obvious question. The S&P 500 and the global equity index are trading at trailing P/E multiples of 19.8 and 15.6 respectively, down from 29.3 and 24.3, respectively a year ago. Is that cheap?
I’d submit that investors should factor in their overall outlook for inflation in the post-Covid and Ukrainian-war world, in determining the answer to this question and whether it is time to buy.
Disclosure: None


