
The Market Pushes Higher

Image Source: Pexels
The Short-Term Trend
This chart showing the SPX's short-term uptrend continues to look good. Perhaps the only disappointment is the lack of a strong breakout from the 6000 level. However, it does look like the SPX wants to inch upwards until it reaches 6150.
The number of new 52-week lows continues to be at harmless levels. There just isn't much in this chart to suggest a price pullback, except that we know that short-term uptrends don't last forever, and this one has lasted a long time and has to crack at some point.

On Thursday, the PMO index dipped as shown by the one lonely red candle, but with Friday's strong session, the PMO is now back up at the top of its range. On Thursday, you couldn't be faulted for thinking that the next short-term downtrend had finally arrived, but in such an incredibly strong uptrend, it isn't surprising to see a false signal or two.

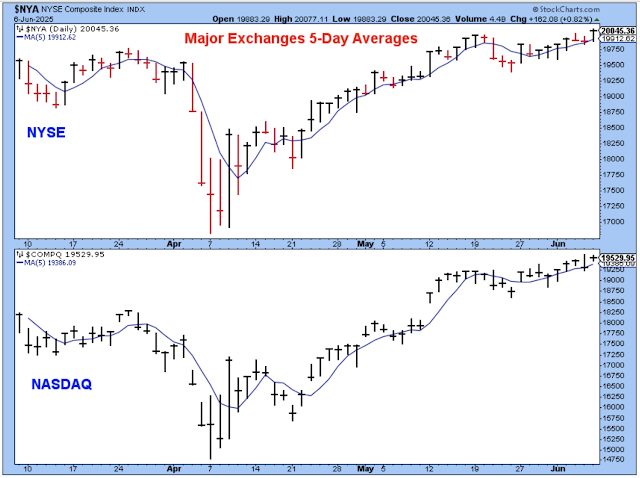
The stock indexes of the two major exchanges continue to move higher and trace their session closes above their 5-day averages. A strong close below the 5-day is usually the first sign of a new short-term downtrend. Until we get that weak close under the 5-day, the major indexes are probably moving higher.
The percentage of stocks above their 50-day averages continues to inch higher, confirming the upward direction of the major stock indexes.

The bullish percents, which are also a breadth measure similar to the percentage above the 50-day, are ticking upwards.

The Summations had been the breadth indicators bucking the trend and showing that the stock market had been weakening a bit behind the scenes. It is often the case that as the major indexes tick higher and higher, breadth starts to weaken, and it is seen as an early warning signal that a price pullback is close.
The Summations had been moving lower, but late this past week, they started to move up again, which confirms higher stock prices.
I don't really know for sure, but I'm guessing that this shows a last gasp for the market.

Looking at the price trend of junk bonds also helps us assess the underlying strength of the market. This chart doesn't help us to understand the next move in the short-term trend, but it does tell us whether we should be buying the next dip in stock prices. In other words, if prices dip but junk bond prices remain relatively strong, the stock price dip is probably a buying opportunity.
This chart shows a good deal of price strength for junk bonds JNK, and so I'd probably be buying when the market sells off. Of course, we also need to wait and see how this ETF performs while stock prices are weak.

Bottom Line: Week after week, the market pushes higher. We know for sure that at some point it has to pull back, or at least falter a bit by moving sideways for a while... but it sure doesn't feel like it now.
I have a large position of gold miners, most of which will probably be sold this coming week. This group is starting to struggle, and their momentum looks toppy. Silver miners perked up noticeably this past week, and I suspect that money is coming out of gold miners in order to buy silver miners.
---------
We are in the sixth year of a relentless push higher for long-term Treasury yields. As shown by this chart, the 30Y yield is likely to hit six-year highs soon. After so many years of such low yields, I think of this rising trend in yields as a good thing for the economy, but it is not happening without difficult adjustments for everyone.
The difficult adjustment that I am focused on is the impact on stock prices. In general, over a period of time, higher yields are regarded as a headwind for stock prices, particularly the price of stocks with high PE multiples. Who knows when this breakout in the 30Y yield will occur, but it certainly looks like it is going to happen.

Here is a look at the gold miners ETF GDX. This price pattern looks really good after a terrific breakout a few months ago. However, if you look at the leading stocks within this group, they look extended to me, and so I've decided to sell a large portion of my holdings. I am not showing the charts of the leading stocks because many of them are rather small companies, and I really don't want anyone to think I am offering buy/sell recommendations on specific stocks, particularly small caps.

Outlook Summary
The short-term trend is UP for stock prices as of Apr-22
The medium-term trend is Neutral for Treasury bond prices
More By This Author:
Will The Market Push Higher Or Plummet From Here?
From Market Crash To Market Optimism
Markets Reversed Higher Despite Low Start
Disclaimer: I am not a registered investment advisor. I am a private investor and blogger. The comments below reflect my view of the market and indicate what I am doing with my own accounts. The ...
more

