Will The Market Push Higher Or Plummet From Here?

Image Source: Pexels
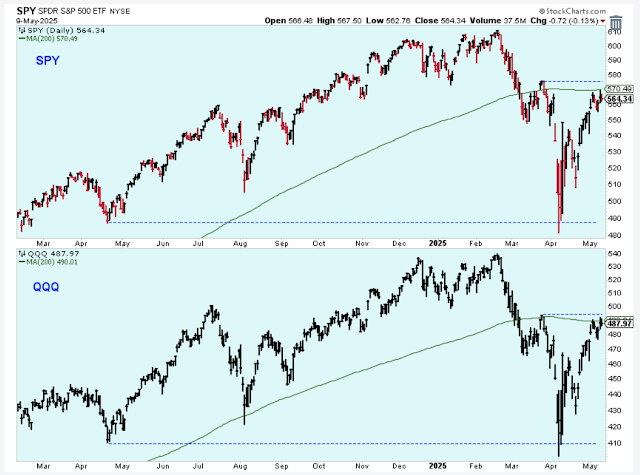
It's certainly been quite an interesting few weeks in the stock market. Stocks have been drawn up by an unknown force, and now? The stock market is at a critical level. Can the SPX push through and move higher, or is this where the next leg down begins?
This chart is an important reminder. The two most important indexes are trading just below their 200-day averages and are up against resistance levels. In my mind, we're in a bear market scenario until both of these indexes are trading above this level of resistance.
Regarding the short-term trend of the market, the PMO index has been at the top of its range for quite some time, and this is about when we should see signs of the next, inevitable short-term downtrend.
The first hint of a downtrend is to see the major indexes close below their five-day averages. So far there have been no solid closes below their five-day averages, and the recent sessions have been a bit weak.
The bullish percents appear to be holding nicely above their five-day averages. Another sign of a new short-term downtrend would be to see these indicators weaken and start to point lower.
There's no sign of weakness in these Summation indexes. The Summations tend to turn lower after the two indicators in the charts above, and thus they help to confirm a change in trend.
Bottom Line
I have purchased small amounts of the best quality stocks with the strongest relative strength scores. Because they are small positions, I can see myself holding these stocks through the ups and downs of a bear market as long as their relative strength remains strong. I feel that this is a good strategy for me, as it allows me to still participate in the market and it keeps me balanced and engaged with what is happening.
I also have quite a bit of my funds invested in the best quality gold miner stocks. I'm watching these quite carefully because I know that if a severe bear market really kicks in, then it will take down all stocks, including the gold miners. However, these stocks are outperforming at the moment, so I will continue holding onto them.
Meanwhile, my longer-term stock market trend indicator has turned positive. I'm not ready to jump back into stocks just because this indicator turned positive, but it is definitely a signal to me not to be too pessimistic about stocks.
Here is another signal that suggests not to get too down and negative towards stocks. This global advance/decline line just keeps heading north. This is a bullish indicator.
Speaking of the gold miners, here is a 20-year look at the gold miner ETF (GDX). The recent price seems to be up against the highs from many years ago. I like the chances of this ETF hitting new highs.
The price of gold looks extended, so a pullback or pause in this uptrend would not be surprising. However, with the price of gold being strong, and even if a pullback was to occur, I continue to think gold miners will remain quite profitable.
Now is a good time to watch the weekly and monthly charts for signs of head-and-shoulder topping patterns. Could this be a top for the leading stocks in our market?
Outlook Summary
- The short-term trend is up for stock prices as of April 22.
- The medium-term trend is neutral for Treasury bond prices.
More By This Author:
From Market Crash To Market OptimismMarkets Reversed Higher Despite Low Start
The Market Could Still Go Lower
Disclaimer: I am not a registered investment advisor. I am a private investor and blogger. The comments below reflect my view of the market and indicate what I am doing with my own accounts. The ...
more


