

Image Source: Unsplash
Some people in the media have been suggesting the bottom is in for the bear market. It isn't my style to predict the market because I don't have the tools or skills for that, but I also don't want to make a prediction and then hope the market does what I predicted just so I can say I was right.
Even though I won't predict the market, I will make a comment about bear markets in general, and I'll hope that I can articulate the difference between predicting and understanding how bear markets have played out in the past.
I tend to see bear markets as having two stages. The first stage is marked by rising oil prices and rising Treasury yields. This is the stage in which people get sucked into buying stocks (sometimes myself included) because prices have dipped so dramatically that everything looks like a bargain.
The second stage is marked by a peak and then a decline in oil prices along with a peak and decline in Treasury yields. With oil and yields behaving themselves, this is another incentive for stock buyers.
But the peak in oil is really a signal that economic activity has fallen, and the decline in yields signals a flight to the safety of Treasury bonds. When the economy is in decline and people are looking for the safety of bonds, it probably isn't the time to be buying stocks.
Of course, every bear market and the recession that usually follows are not the same, but I won't mind if I'm late to the next bull market as opposed to being early. If I buy too early, I'm going to throw in the towel and sell stocks just at the worst moment, and after I endure the pain of selling I won't be in the proper mindset to see the opportunity to get back into the market.
Looking at the short-term trend, the rally that started mid-October continues to chop and stair-step higher. As well, the PMO is once again at the top of its range that it first reached in mid-October. So, even though it is a favorable seasonal period for stock prices, with the PMO at the top of the range, the best time to buy stocks in the short-term has passed.

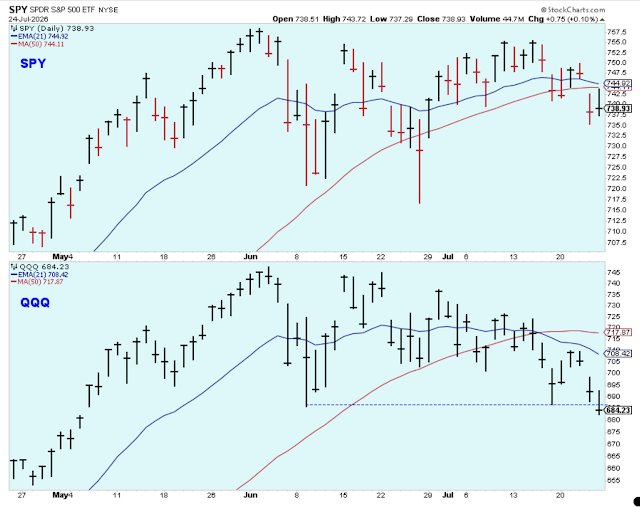
The SPX has rallied up to resistance, and it is having a little trouble breaking above this level. With the PMO at the top of its range, it means that I am looking for levels to sell into, and there are a couple of obvious short-term targets above the current price. I will probably wait to do any selling though, at least until after the SPX breaks below the tiny uptrend line.

In the short-term, the VIX has declined to a level where I would expect it to start to level off, which means that the SPX will probably start to top out. With the VIX at the current level, the PMO index is confirmed, and this means that it is not a good time to be a buyer.

This is another chart which also shows that now isn't the best time to be a buyer. The SPX equal-weight has rallied up to its downtrend line and to a prior horizontal resistance level. Also, the slow-moving KST momentum indicator has reached up to a level where you'd expect it to start to peak and turn lower.

This junk bonds ETF has also rallied up to its downtrend line and looks similar to the chart above, although the signal isn't as clear as it is in the chart above. This is the chart I'll be watching most closely because when junk bond prices start to turn lower, it is usually a signal that stocks are headed lower, too.

This chart makes it hard to see, but new 52-week lows have been elevated. During a short-term rally, I want to see new lows hold near or below the 50-level. Over the past two weeks, there have been several days where the new lows on the NYSE have been above 50, although this isn't really an alarming level.
However, for the Nasdaq, the level of new lows is dangerously high. I feel confident saying that the risk of another significant market decline is high with new lows on the Nasdaq at current levels.

Bottom Line: I am mostly in cash with one large short position and a number of very small long positions in the best-performing stocks.
Oil prices broke their uptrend earlier in the year, but they never really broke down in a convincing way. However, now it looks like it could be a possibility, with the 30-week pointing lower and prices close to falling off the cliff.

Based on this chart, it looks very likely to me that Treasury yields have peaked and are heading lower. All three of these yields are nicely below their 50-day averages, and the 30-year is leading yields lower.

A number of people on CNBC have been recommending small-caps because they are an alternative when the large-caps are hurt by a strong dollar. Not me. In my opinion, this looks like an index that is getting ready to turn lower after touching resistance. We'll know if I'm wrong if the IWM pops up above this downtrend line.

Now for one last chart. I'm showing this chart again because I mentioned earlier how important the level of new 52-week lows becomes when looking for a bottom in the stock market. This is a picture of the market in 2009 near the end of the bear market, and you can see how the new lows just disappeared in March of 2009. This is what I am looking for as a signal to buy stocks again.

Outlook Summary
- The short-term trend is up for stock prices as of Oct. 13.
- The economy is at risk of recession as of March 2022.
- The medium-term trend is higher for treasury bond prices as of Nov. 19.
More By This Author:
The Short-Term Uptrend Continues Despite UncertaintyThe Short-Term Downtrend Continues Amid Market Turmoil
The Short-Term Downtrend Continues Despite The Rise


Comments
Log in or sign up to join the conversation.