
Speculators Drop 2-Year, 5-Year & 10-Year Bonds Bets To New Record Lows
Here are the latest charts and statistics for the Commitment of Traders (COT) reports data published by the Commodities Futures Trading Commission (CFTC).
The latest COT data is updated through Tuesday May 30th and shows a quick view of how large traders (for-profit speculators and commercial hedgers) were positioned in the futures markets.
Weekly Speculator Changes led by SOFR 3-Months & Ultra 10-Year Bonds
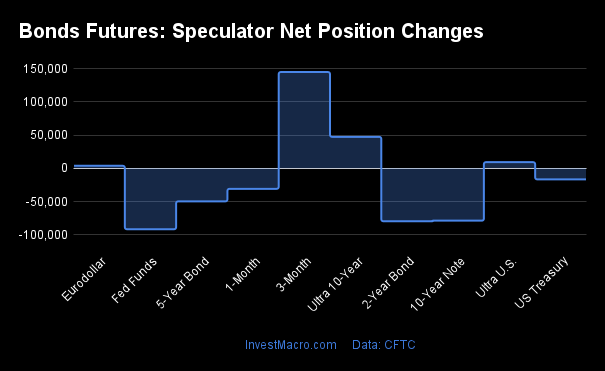
The COT bond market speculator bets were lower this week as four out of the nine bond markets we cover had higher positioning while the other five markets had lower speculator contracts.
Leading the gains for the bond markets was the SOFR 3-Months (144,765 contracts) with the Ultra 10-Year Bonds (47,285 contracts), the Ultra Treasury Bonds (9,208 contracts) and the Eurodollar (3,739 contracts) also showing positive weeks.
The bond markets with declines in speculator bets for the week were the Fed Funds (-91,660 contracts), the 10-Year Bonds (-78,783 contracts), the 2-Year Bonds (-79,661 contracts), the 5-Year Bonds (-49,768 contracts) and the US Treasury Bonds (-16,677 contracts) also registering lower bets on the week.
Speculators drop 2-Year, 5-Year & 10-Year Bonds bets to new record lows
Highlighting the COT bonds data this week was the further rise in the record bearish speculator positions for the 2-Year, 5-Year and 10-Year bonds.
The large speculators in the 2-Year bonds sharply decreased (weekly change of -79,661 contracts) their bets for the fifth consecutive week this week. The speculative position has now added a gigantic total of -423,556 contracts to the bearish position in just the past five weeks alone. This brings the overall net position to the new all-time record bearish level of -969,863 contracts.
The 5-Year Bond speculator positions also fell once again this week by -49,768 contracts and have now declined for six consecutive weeks. The 5-Year speculator bets have added a total of -229,335 contracts to the bearish position in just the past six weeks and have established a new record bearish level of -983,837 contracts.
Large speculative 10-Year Bond positions also continued to fall this week for a second straight week. The -157,979 contract shortfall over the past two weeks has dropped the 10-Year to its own all-time record low for a second consecutive week with this week’s record at a total of -850,421 contracts.
The latest data is through Tuesday and prior to the final agreement on the debt ceiling so it will be interesting to see if there are sharp adjustments made in next week’s data with a new debt ceiling deal done.
All three bond markets saw higher futures prices to close out the week and remain off their lows of this bearish cycle despite the speculator’s historically weak sentiment. The 2-Year is higher by approximately 1.40 percent from its March 2023 low, the 5-Year is higher by approximately 3 percent from the October 2022 low while the 10-Year is higher by approximately 4.50 percent from its own October 2022 low-point.
|
May-30-2023
|
OI
|
OI-Index
|
Spec-Net
|
Spec-Index
|
Com-Net
|
COM-Index
|
Smalls-Net
|
Smalls-Index
|
|---|---|---|---|---|---|---|---|---|
| 5-Year | 4,871,724 | 88 | -983,837 | 0 | 922,460 | 100 | 61,377 | 98 |
| 10-Year | 4,728,273 | 90 | -850,421 | 0 | 758,535 | 100 | 91,886 | 94 |
| 2-Year | 3,162,876 | 93 | -969,863 | 0 | 885,109 | 100 | 84,754 | 96 |
| FedFunds | 1,855,851 | 77 | -180,155 | 17 | 189,980 | 83 | -9,825 | 72 |
| Long T-Bond | 1,280,460 | 78 | -59,913 | 65 | 12,279 | 15 | 47,634 | 83 |
| Eurodollar | 560,386 | 0 | -37,810 | 73 | 45,422 | 23 | -7,612 | 98 |
Strength Scores led by SOFR 3-Months & Eurodollar
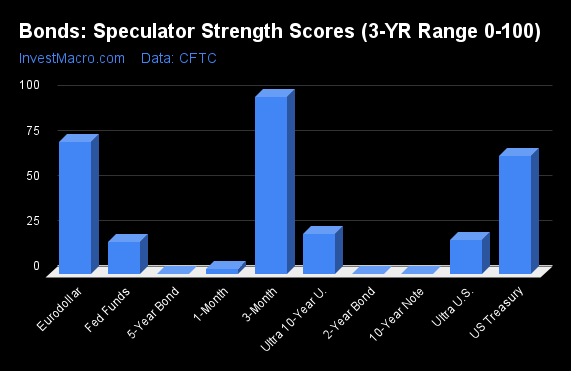
COT Strength Scores (a normalized measure of Speculator positions over a 3-Year range, from 0 to 100 where above 80 is Extreme-Bullish and below 20 is Extreme-Bearish) showed that the SOFR 3-Months (98 percent) and the Eurodollar (73 percent) lead the bond markets this week. The US Treasury Bonds (65 percent) comes in as the next highest in the weekly strength scores.
On the downside, the 5-Year Bonds (0 percent), the 10-Year Bonds (0 percent), the 2-Year Bonds (0 percent) and the Fed Funds (17 percent) come in at the lowest strength level currently and are in Extreme-Bearish territory (below 20 percent).
Strength Statistics:
Fed Funds (17.5 percent) vs Fed Funds previous week (28.8 percent)
2-Year Bond (0.0 percent) vs 2-Year Bond previous week (7.5 percent)
5-Year Bond (0.0 percent) vs 5-Year Bond previous week (4.6 percent)
10-Year Bond (0.0 percent) vs 10-Year Bond previous week (7.6 percent)
Ultra 10-Year Bond (21.9 percent) vs Ultra 10-Year Bond previous week (12.2 percent)
US Treasury Bond (65.1 percent) vs US Treasury Bond previous week (70.5 percent)
Ultra US Treasury Bond (18.7 percent) vs Ultra US Treasury Bond previous week (14.8 percent)
Eurodollar (73.1 percent) vs Eurodollar previous week (73.0 percent)
SOFR 3-Months (98.0 percent) vs SOFR 3-Months previous week (86.3 percent)
SOFR 3-Months & US Treasury Bonds top the 6-Week Strength Trends
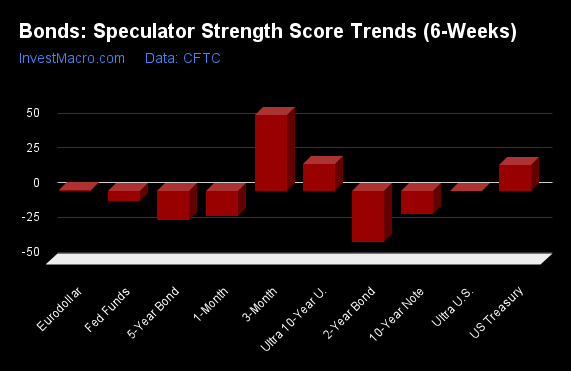
COT Strength Score Trends (or move index, calculates the 6-week changes in strength scores) showed that the SOFR 3-Months (54 percent) and the US Treasury Bonds (19 percent) lead the past six weeks trends for bonds. The Ultra 10-Year Bonds (19 percent) is the next highest positive mover in the latest trends data.
The 2-Year Bond (-37.3 percent) and the 5-Year Bonds (-21 percent) lead the downside trend scores currently with the 10-Year Bonds (-17 percent) and the Fed Funds (-8 percent) following next with lower trend scores.
Strength Trend Statistics:
Fed Funds (-7.6 percent) vs Fed Funds previous week (9.8 percent)
2-Year Bond (-37.3 percent) vs 2-Year Bond previous week (-37.2 percent)
5-Year Bond (-21.2 percent) vs 5-Year Bond previous week (-15.9 percent)
10-Year Bond (-16.5 percent) vs 10-Year Bond previous week (-12.9 percent)
Ultra 10-Year Bond (19.5 percent) vs Ultra 10-Year Bond previous week (7.9 percent)
US Treasury Bond (18.6 percent) vs US Treasury Bond previous week (29.1 percent)
Ultra US Treasury Bond (-0.4 percent) vs Ultra US Treasury Bond previous week (-4.2 percent)
Eurodollar (0.3 percent) vs Eurodollar previous week (15.6 percent)
SOFR 3-Months (54.2 percent) vs SOFR 3-Months previous week (4.7 percent)
Individual Bond Markets:
3-Month Eurodollars Futures:
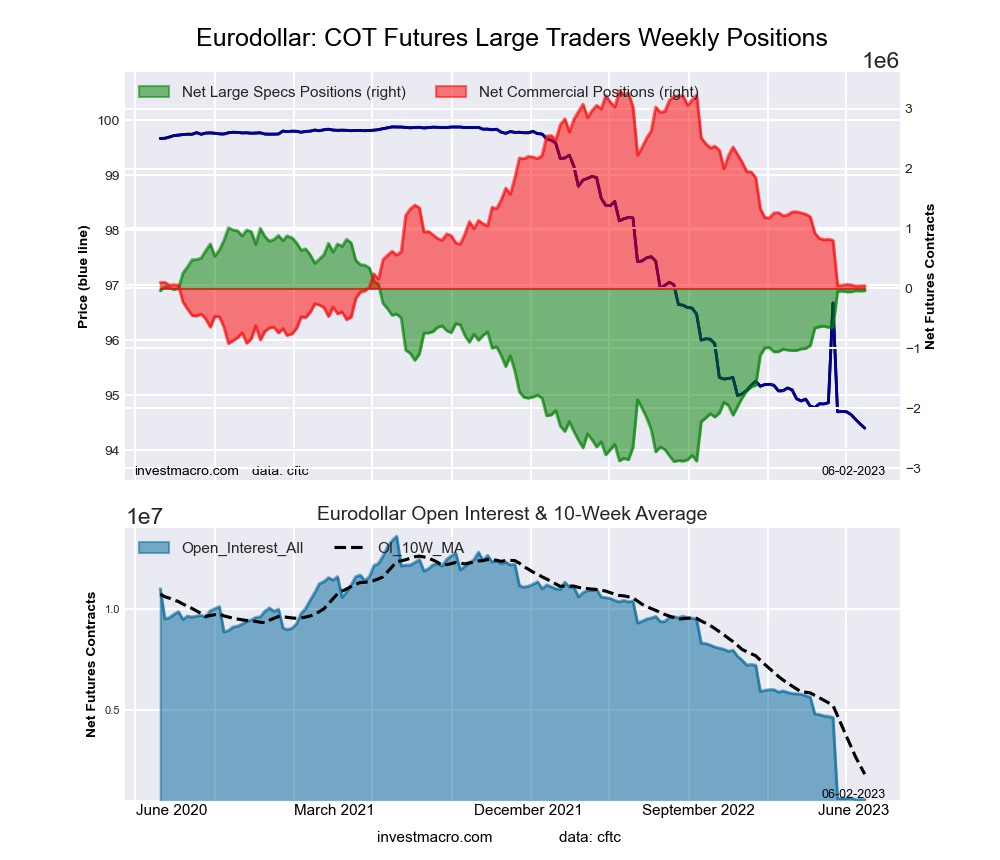
The 3-Month Eurodollars large speculator standing this week equaled a net position of -37,810 contracts in the data reported through Tuesday. This was a weekly rise of 3,739 contracts from the previous week which had a total of -41,549 net contracts.
This week’s current strength score (the trader positioning range over the past three years, measured from 0 to 100) shows the speculators are currently Bullish with a score of 73.1 percent. The commercials are Bearish with a score of 22.8 percent and the small traders (not shown in chart) are Bullish-Extreme with a score of 97.6 percent.
| 3-Month Eurodollars Statistics | SPECULATORS | COMMERCIALS | SMALL TRADERS |
| – Percent of Open Interest Longs: | 28.8 | 61.4 | 9.8 |
| – Percent of Open Interest Shorts: | 35.6 | 53.3 | 11.2 |
| – Net Position: | -37,810 | 45,422 | -7,612 |
| – Gross Longs: | 161,451 | 344,051 | 54,884 |
| – Gross Shorts: | 199,261 | 298,629 | 62,496 |
| – Long to Short Ratio: | 0.8 to 1 | 1.2 to 1 | 0.9 to 1 |
| NET POSITION TREND: | |||
| – Strength Index Score (3 Year Range Pct): | 73.1 | 22.8 | 97.6 |
| – Strength Index Reading (3 Year Range): | Bullish | Bearish | Bullish-Extreme |
| NET POSITION MOVEMENT INDEX: | |||
| – 6-Week Change in Strength Index: | 0.3 | -0.0 | -2.4 |
Secured Overnight Financing Rate (3-Month) Futures:
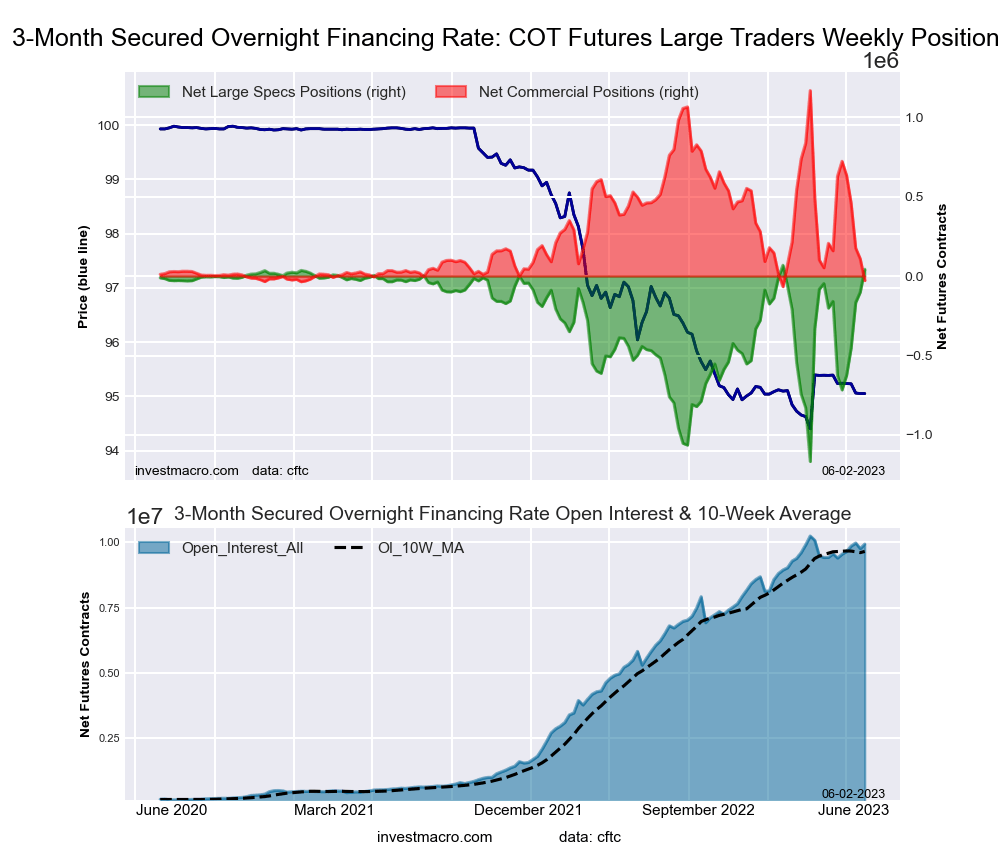
The Secured Overnight Financing Rate (3-Month) large speculator standing this week equaled a net position of 43,222 contracts in the data reported through Tuesday. This was a weekly lift of 144,765 contracts from the previous week which had a total of -101,543 net contracts.
This week’s current strength score (the trader positioning range over the past three years, measured from 0 to 100) shows the speculators are currently Bullish-Extreme with a score of 98.0 percent. The commercials are Bearish-Extreme with a score of 3.1 percent and the small traders (not shown in chart) are Bullish with a score of 79.6 percent.
| SOFR 3-Months Statistics | SPECULATORS | COMMERCIALS | SMALL TRADERS |
| – Percent of Open Interest Longs: | 17.0 | 61.0 | 0.5 |
| – Percent of Open Interest Shorts: | 16.6 | 61.3 | 0.6 |
| – Net Position: | 43,222 | -28,251 | -14,971 |
| – Gross Longs: | 1,690,850 | 6,052,948 | 45,501 |
| – Gross Shorts: | 1,647,628 | 6,081,199 | 60,472 |
| – Long to Short Ratio: | 1.0 to 1 | 1.0 to 1 | 0.8 to 1 |
| NET POSITION TREND: | |||
| – Strength Index Score (3 Year Range Pct): | 98.0 | 3.1 | 79.6 |
| – Strength Index Reading (3 Year Range): | Bullish-Extreme | Bearish-Extreme | Bullish |
| NET POSITION MOVEMENT INDEX: | |||
| – 6-Week Change in Strength Index: | 54.2 | -53.2 | -7.3 |
30-Day Federal Funds Futures:
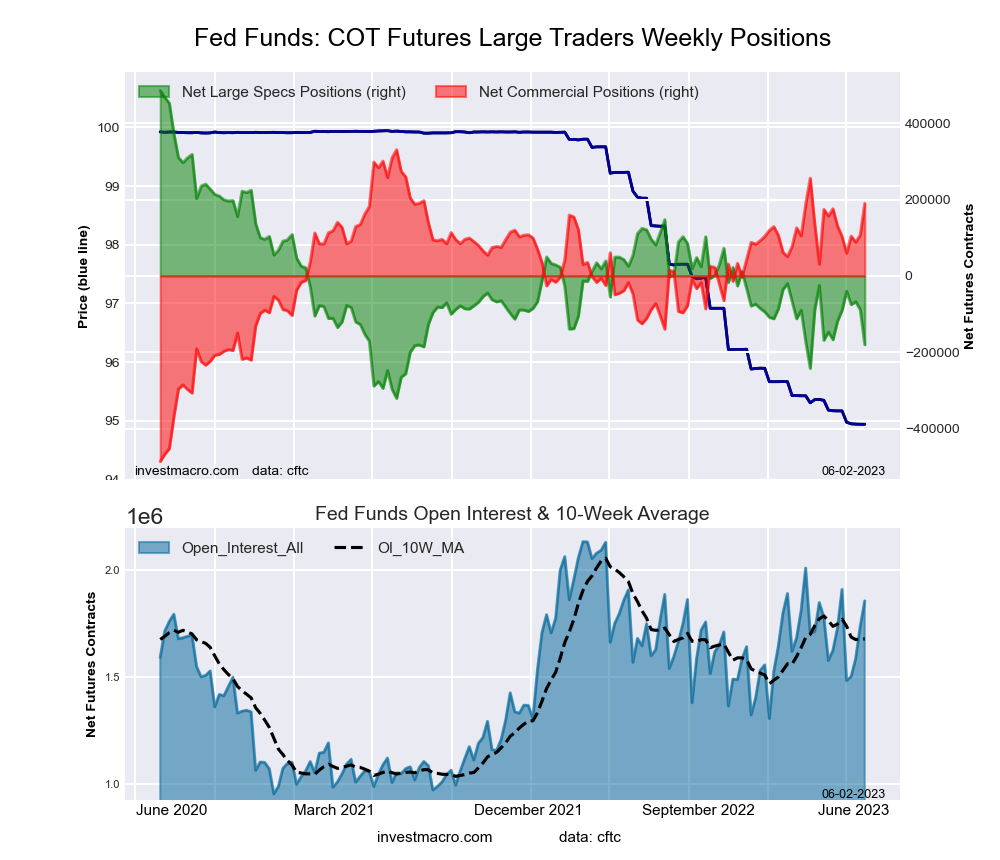
The 30-Day Federal Funds large speculator standing this week equaled a net position of -180,155 contracts in the data reported through Tuesday. This was a weekly fall of -91,660 contracts from the previous week which had a total of -88,495 net contracts.
This week’s current strength score (the trader positioning range over the past three years, measured from 0 to 100) shows the speculators are currently Bearish-Extreme with a score of 17.5 percent. The commercials are Bullish-Extreme with a score of 82.8 percent and the small traders (not shown in chart) are Bullish with a score of 71.7 percent.
| 30-Day Federal Funds Statistics | SPECULATORS | COMMERCIALS | SMALL TRADERS |
| – Percent of Open Interest Longs: | 6.2 | 76.9 | 2.3 |
| – Percent of Open Interest Shorts: | 15.9 | 66.7 | 2.9 |
| – Net Position: | -180,155 | 189,980 | -9,825 |
| – Gross Longs: | 115,276 | 1,427,182 | 43,471 |
| – Gross Shorts: | 295,431 | 1,237,202 | 53,296 |
| – Long to Short Ratio: | 0.4 to 1 | 1.2 to 1 | 0.8 to 1 |
| NET POSITION TREND: | |||
| – Strength Index Score (3 Year Range Pct): | 17.5 | 82.8 | 71.7 |
| – Strength Index Reading (3 Year Range): | Bearish-Extreme | Bullish-Extreme | Bullish |
| NET POSITION MOVEMENT INDEX: | |||
| – 6-Week Change in Strength Index: | -7.6 | 7.3 | 4.0 |
2-Year Treasury Note Futures:
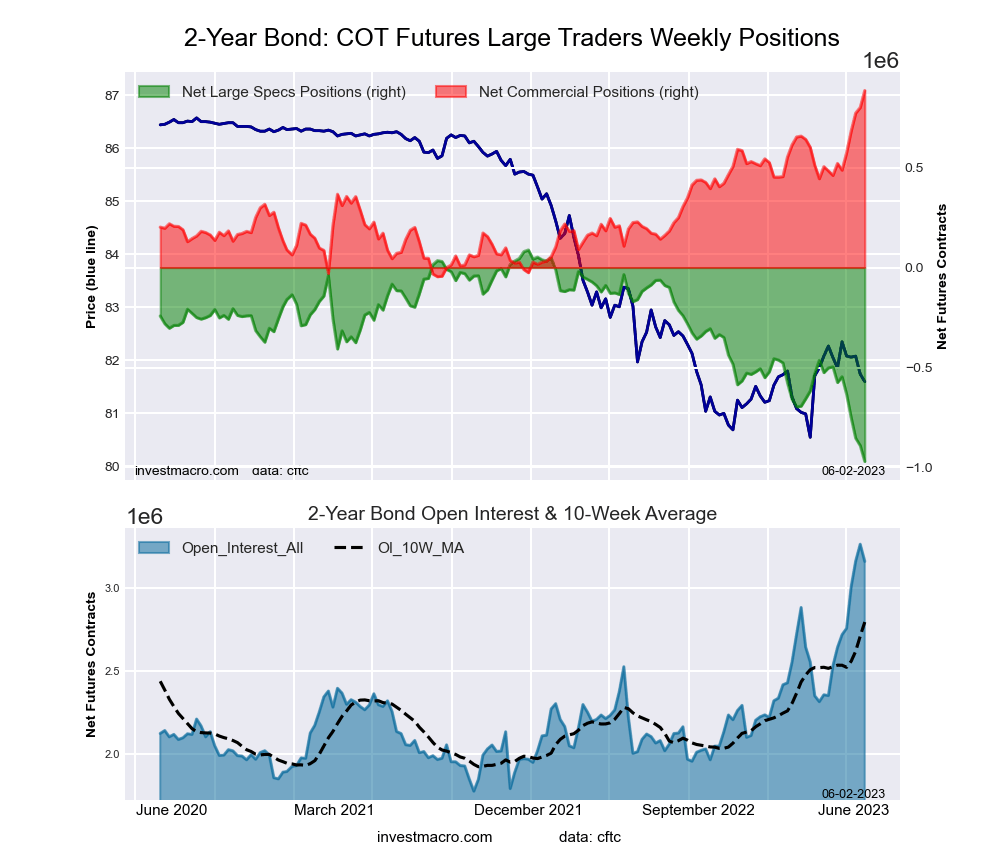
The 2-Year Treasury Note large speculator standing this week equaled a net position of -969,863 contracts in the data reported through Tuesday. This was a weekly lowering of -79,661 contracts from the previous week which had a total of -890,202 net contracts.
This week’s current strength score (the trader positioning range over the past three years, measured from 0 to 100) shows the speculators are currently Bearish-Extreme with a score of 0.0 percent. The commercials are Bullish-Extreme with a score of 100.0 percent and the small traders (not shown in chart) are Bullish-Extreme with a score of 96.4 percent.
| 2-Year Treasury Note Statistics | SPECULATORS | COMMERCIALS | SMALL TRADERS |
| – Percent of Open Interest Longs: | 7.7 | 83.8 | 7.4 |
| – Percent of Open Interest Shorts: | 38.3 | 55.9 | 4.7 |
| – Net Position: | -969,863 | 885,109 | 84,754 |
| – Gross Longs: | 242,645 | 2,651,778 | 233,553 |
| – Gross Shorts: | 1,212,508 | 1,766,669 | 148,799 |
| – Long to Short Ratio: | 0.2 to 1 | 1.5 to 1 | 1.6 to 1 |
| NET POSITION TREND: | |||
| – Strength Index Score (3 Year Range Pct): | 0.0 | 100.0 | 96.4 |
| – Strength Index Reading (3 Year Range): | Bearish-Extreme | Bullish-Extreme | Bullish-Extreme |
| NET POSITION MOVEMENT INDEX: | |||
| – 6-Week Change in Strength Index: | -37.3 | 39.2 | 14.6 |
5-Year Treasury Note Futures:
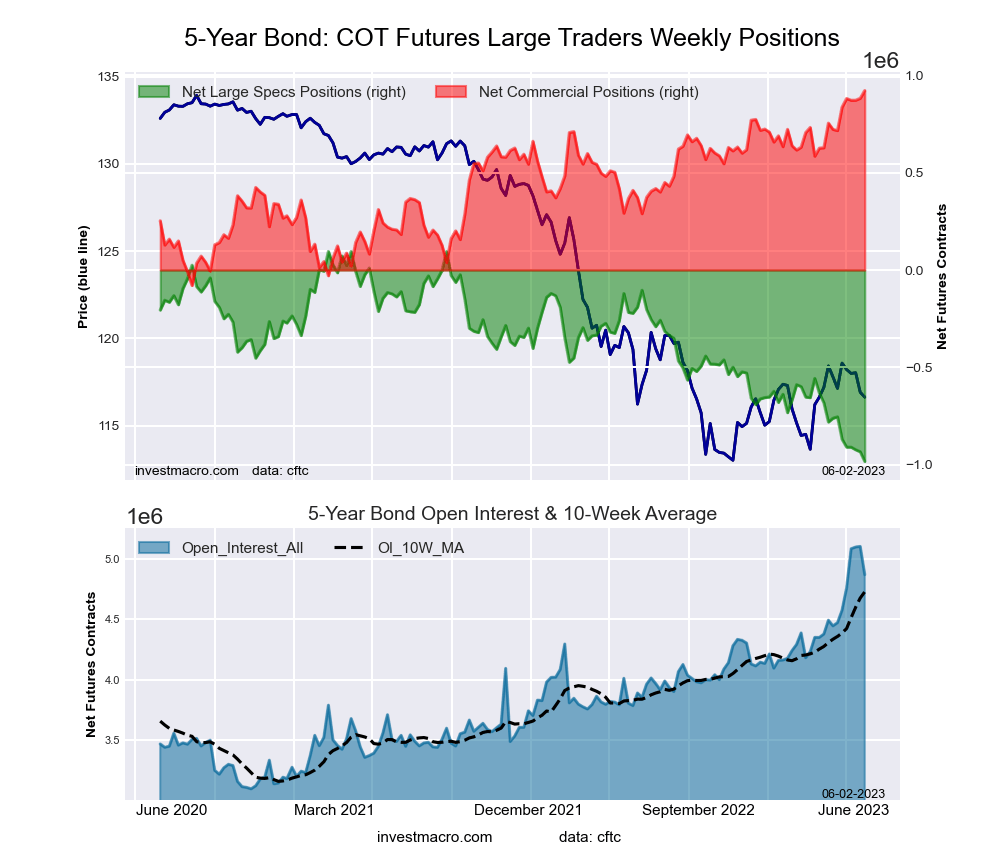
The 5-Year Treasury Note large speculator standing this week equaled a net position of -983,837 contracts in the data reported through Tuesday. This was a weekly lowering of -49,768 contracts from the previous week which had a total of -934,069 net contracts.
This week’s current strength score (the trader positioning range over the past three years, measured from 0 to 100) shows the speculators are currently Bearish-Extreme with a score of 0.0 percent. The commercials are Bullish-Extreme with a score of 100.0 percent and the small traders (not shown in chart) are Bullish-Extreme with a score of 97.9 percent.
| 5-Year Treasury Note Statistics | SPECULATORS | COMMERCIALS | SMALL TRADERS |
| – Percent of Open Interest Longs: | 6.9 | 83.4 | 7.6 |
| – Percent of Open Interest Shorts: | 27.1 | 64.5 | 6.3 |
| – Net Position: | -983,837 | 922,460 | 61,377 |
| – Gross Longs: | 338,249 | 4,064,536 | 368,659 |
| – Gross Shorts: | 1,322,086 | 3,142,076 | 307,282 |
| – Long to Short Ratio: | 0.3 to 1 | 1.3 to 1 | 1.2 to 1 |
| NET POSITION TREND: | |||
| – Strength Index Score (3 Year Range Pct): | 0.0 | 100.0 | 97.9 |
| – Strength Index Reading (3 Year Range): | Bearish-Extreme | Bullish-Extreme | Bullish-Extreme |
| NET POSITION MOVEMENT INDEX: | |||
| – 6-Week Change in Strength Index: | -21.2 | 20.5 | 6.5 |
10-Year Treasury Note Futures:
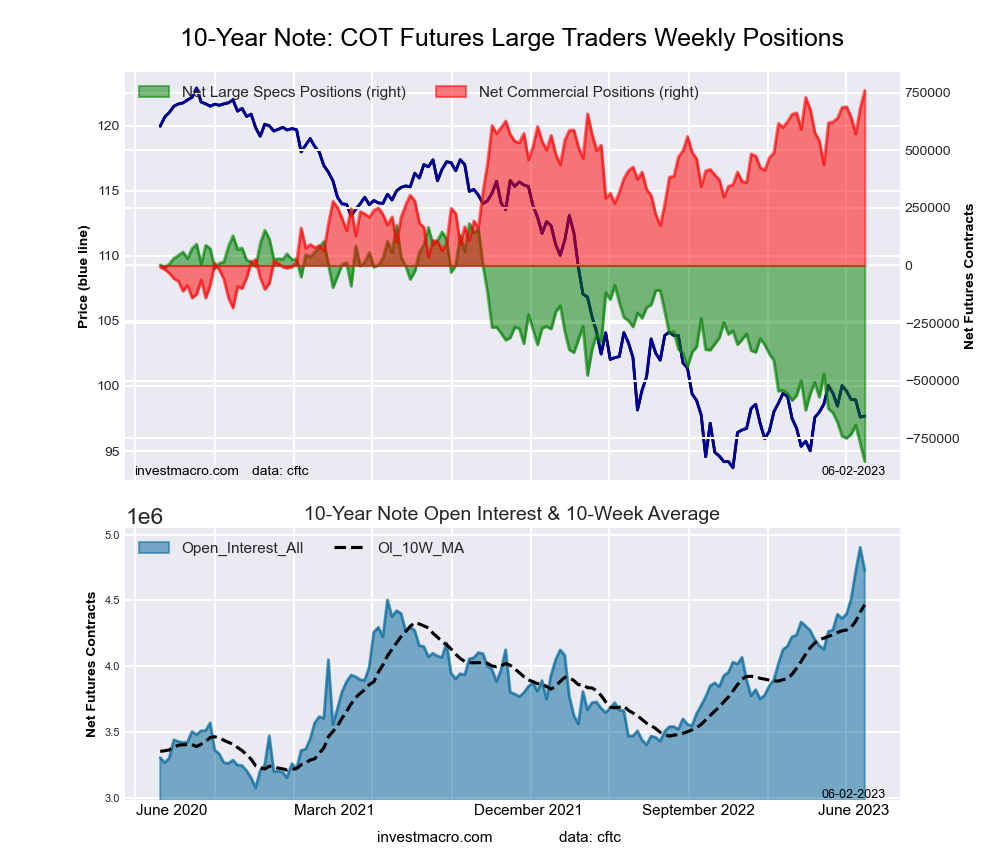
The 10-Year Treasury Note large speculator standing this week equaled a net position of -850,421 contracts in the data reported through Tuesday. This was a weekly reduction of -78,783 contracts from the previous week which had a total of -771,638 net contracts.
This week’s current strength score (the trader positioning range over the past three years, measured from 0 to 100) shows the speculators are currently Bearish-Extreme with a score of 0.0 percent. The commercials are Bullish-Extreme with a score of 100.0 percent and the small traders (not shown in chart) are Bullish-Extreme with a score of 93.5 percent.
| 10-Year Treasury Note Statistics | SPECULATORS | COMMERCIALS | SMALL TRADERS |
| – Percent of Open Interest Longs: | 8.7 | 79.8 | 8.8 |
| – Percent of Open Interest Shorts: | 26.7 | 63.8 | 6.9 |
| – Net Position: | -850,421 | 758,535 | 91,886 |
| – Gross Longs: | 412,506 | 3,774,585 | 417,126 |
| – Gross Shorts: | 1,262,927 | 3,016,050 | 325,240 |
| – Long to Short Ratio: | 0.3 to 1 | 1.3 to 1 | 1.3 to 1 |
| NET POSITION TREND: | |||
| – Strength Index Score (3 Year Range Pct): | 0.0 | 100.0 | 93.5 |
| – Strength Index Reading (3 Year Range): | Bearish-Extreme | Bullish-Extreme | Bullish-Extreme |
| NET POSITION MOVEMENT INDEX: | |||
| – 6-Week Change in Strength Index: | -16.5 | 12.7 | 11.0 |
Ultra 10-Year Notes Futures:
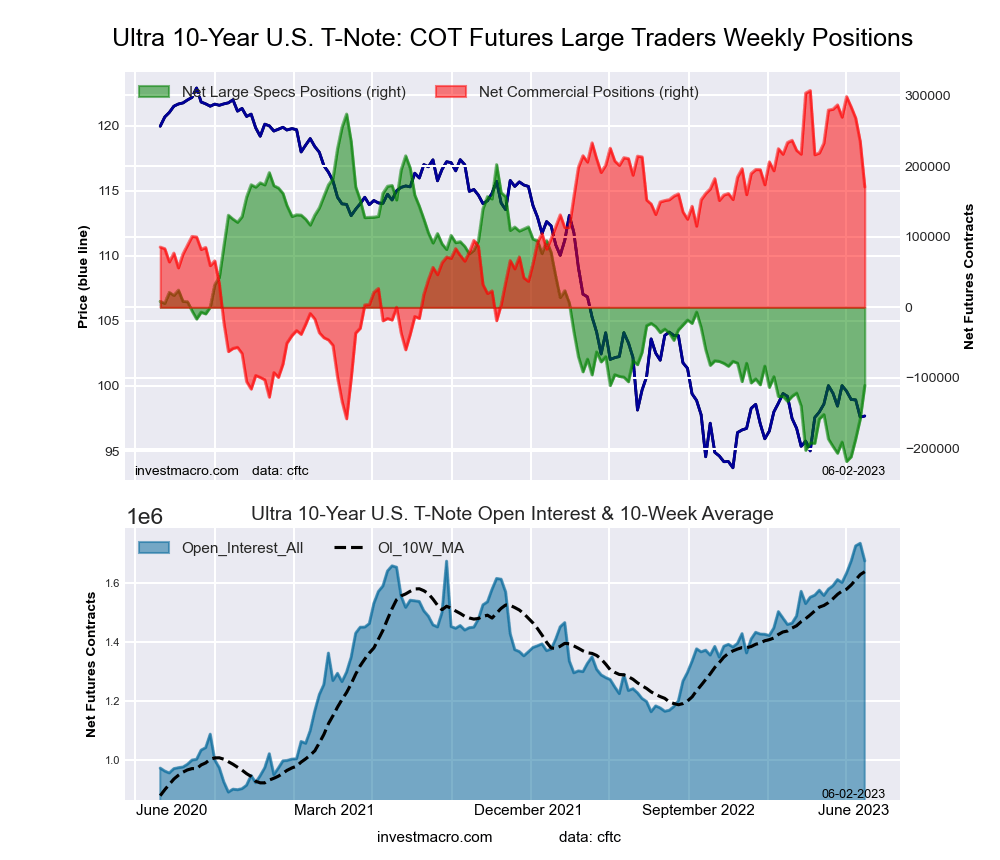
The Ultra 10-Year Notes large speculator standing this week equaled a net position of -110,794 contracts in the data reported through Tuesday. This was a weekly lift of 47,285 contracts from the previous week which had a total of -158,079 net contracts.
This week’s current strength score (the trader positioning range over the past three years, measured from 0 to 100) shows the speculators are currently Bearish with a score of 21.9 percent. The commercials are Bullish with a score of 70.6 percent and the small traders (not shown in chart) are Bullish with a score of 78.5 percent.
| Ultra 10-Year Notes Statistics | SPECULATORS | COMMERCIALS | SMALL TRADERS |
| – Percent of Open Interest Longs: | 12.2 | 75.1 | 11.1 |
| – Percent of Open Interest Shorts: | 18.8 | 64.9 | 14.7 |
| – Net Position: | -110,794 | 170,548 | -59,754 |
| – Gross Longs: | 203,767 | 1,258,392 | 185,836 |
| – Gross Shorts: | 314,561 | 1,087,844 | 245,590 |
| – Long to Short Ratio: | 0.6 to 1 | 1.2 to 1 | 0.8 to 1 |
| NET POSITION TREND: | |||
| – Strength Index Score (3 Year Range Pct): | 21.9 | 70.6 | 78.5 |
| – Strength Index Reading (3 Year Range): | Bearish | Bullish | Bullish |
| NET POSITION MOVEMENT INDEX: | |||
| – 6-Week Change in Strength Index: | 19.5 | -25.0 | 12.0 |
US Treasury Bonds Futures:
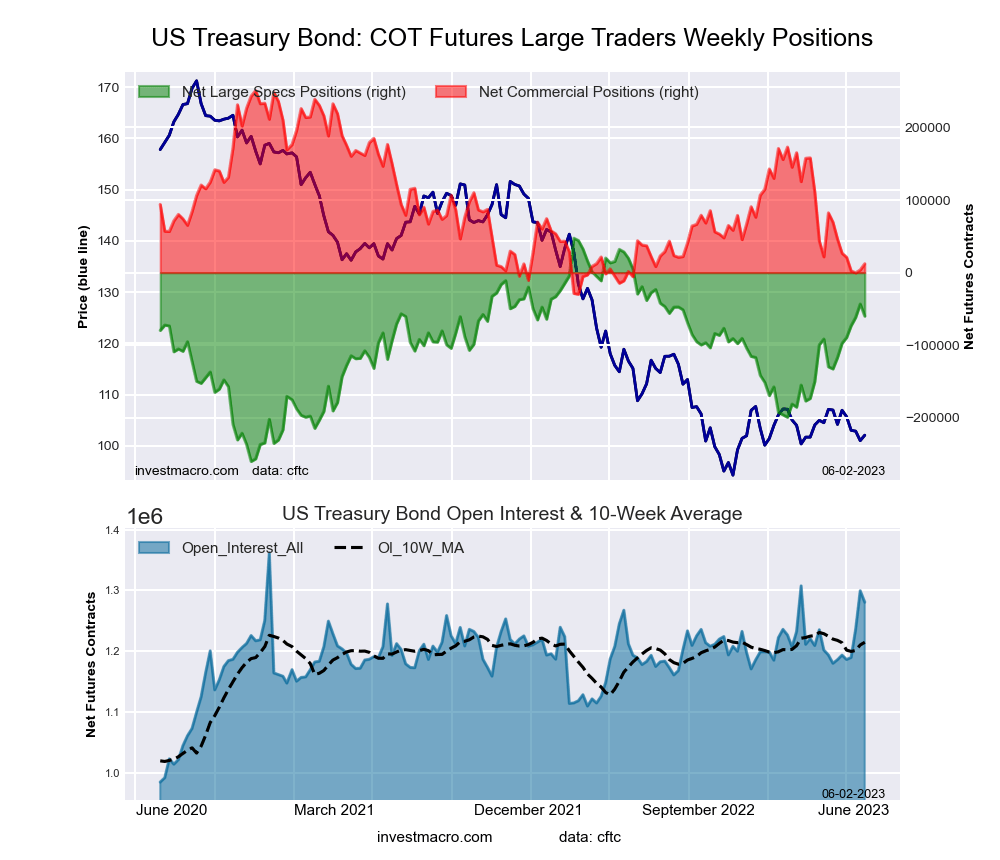
The US Treasury Bonds large speculator standing this week equaled a net position of -59,913 contracts in the data reported through Tuesday. This was a weekly decline of -16,677 contracts from the previous week which had a total of -43,236 net contracts.
This week’s current strength score (the trader positioning range over the past three years, measured from 0 to 100) shows the speculators are currently Bullish with a score of 65.1 percent. The commercials are Bearish-Extreme with a score of 15.0 percent and the small traders (not shown in chart) are Bullish-Extreme with a score of 83.1 percent.
| US Treasury Bonds Statistics | SPECULATORS | COMMERCIALS | SMALL TRADERS |
| – Percent of Open Interest Longs: | 8.4 | 73.3 | 14.6 |
| – Percent of Open Interest Shorts: | 13.1 | 72.3 | 10.9 |
| – Net Position: | -59,913 | 12,279 | 47,634 |
| – Gross Longs: | 108,088 | 938,620 | 187,052 |
| – Gross Shorts: | 168,001 | 926,341 | 139,418 |
| – Long to Short Ratio: | 0.6 to 1 | 1.0 to 1 | 1.3 to 1 |
| NET POSITION TREND: | |||
| – Strength Index Score (3 Year Range Pct): | 65.1 | 15.0 | 83.1 |
| – Strength Index Reading (3 Year Range): | Bullish | Bearish-Extreme | Bullish-Extreme |
| NET POSITION MOVEMENT INDEX: | |||
| – 6-Week Change in Strength Index: | 18.6 | -12.1 | -16.8 |
Ultra US Treasury Bonds Futures:
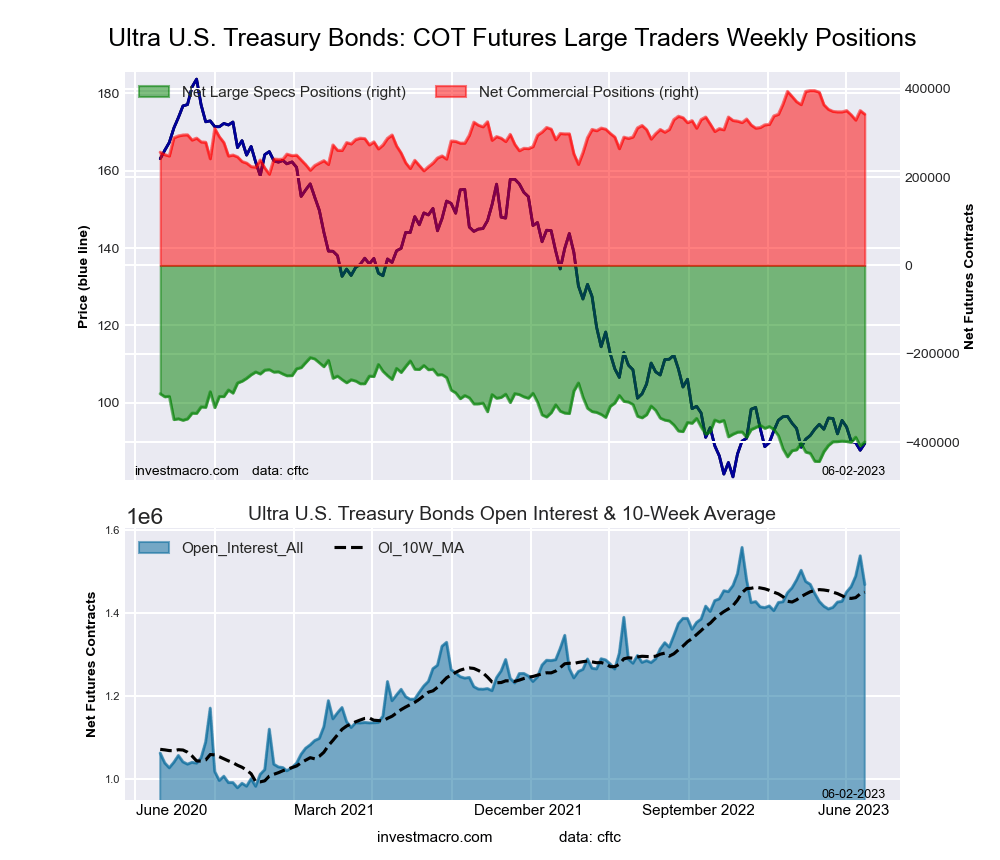
The Ultra US Treasury Bonds large speculator standing this week equaled a net position of -399,900 contracts in the data reported through Tuesday. This was a weekly rise of 9,208 contracts from the previous week which had a total of -409,108 net contracts.
This week’s current strength score (the trader positioning range over the past three years, measured from 0 to 100) shows the speculators are currently Bearish-Extreme with a score of 18.7 percent. The commercials are Bullish with a score of 71.7 percent and the small traders (not shown in chart) are Bullish-Extreme with a score of 97.4 percent.
| Ultra US Treasury Bonds Statistics | SPECULATORS | COMMERCIALS | SMALL TRADERS |
| – Percent of Open Interest Longs: | 5.5 | 81.6 | 11.9 |
| – Percent of Open Interest Shorts: | 32.7 | 58.3 | 8.0 |
| – Net Position: | -399,900 | 342,324 | 57,576 |
| – Gross Longs: | 80,393 | 1,198,201 | 175,098 |
| – Gross Shorts: | 480,293 | 855,877 | 117,522 |
| – Long to Short Ratio: | 0.2 to 1 | 1.4 to 1 | 1.5 to 1 |
| NET POSITION TREND: | |||
| – Strength Index Score (3 Year Range Pct): | 18.7 | 71.7 | 97.4 |
| – Strength Index Reading (3 Year Range): | Bearish-Extreme | Bullish | Bullish-Extreme |
| NET POSITION MOVEMENT INDEX: | |||
| – 6-Week Change in Strength Index: | -0.4 | -2.7 | 6.1 |
*COT Report: The COT data, released weekly to the public each Friday, is updated through the most recent Tuesday (data is 3 days old) and shows a quick view of how large speculators or non-commercials (for-profit traders) were positioned in the futures markets.
The CFTC categorizes trader positions according to commercial hedgers (traders who use futures contracts for hedging as part of the business), non-commercials (large traders who speculate to realize trading profits) and nonreportable traders (usually small traders/speculators) as well as their open interest (contracts open in the market at time of reporting). See CFTC criteria here.
More By This Author:
Speculator Extremes: MXN, Cocoa, US Bonds Lead Bullish & Bearish Positions
Currency Speculators Drop Japanese Yen Bets To 30-Week Low
Speculators Drop Their 10-Year Bonds Bets To Lowest Level On Record
Disclosure: Foreign Currency trading and trading on margin carries a high level of risk and can result in loss of part or all of your investment.Due to the level of risk and market volatility, ...
more

