
S&P 500 Earnings Update
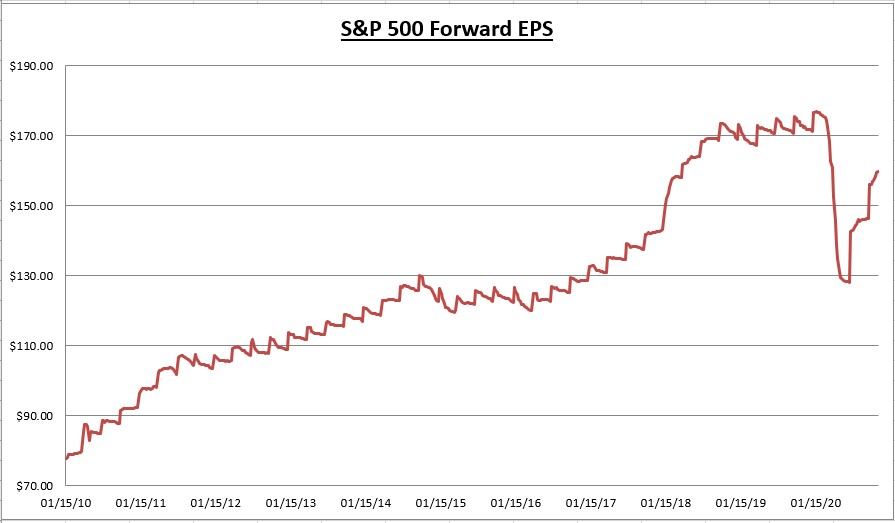
The combined earnings per share for all S&P 500 companies ticked up again last week, from $159.47 to $159.92. The combined EPS reported in 2019 was $162.93, which is now only 1.85% above the current forward estimates.
92% of S&P 500 companies have now reported Q3 results, with 84% reporting earnings above expectations and 73% reporting revenues above expectations. In total, S&P 500 companies have reported earnings that are 19.4% above expectations. (FACTSET)
Q3 earnings are down -7.5% from last year and aren’t projected to return to growth until Q1 2021. It’s still a stark improvement in expectations from 6 months ago. Of the 63 companies that issued Q4 guidance, 70% of those companies issued positive guidance.
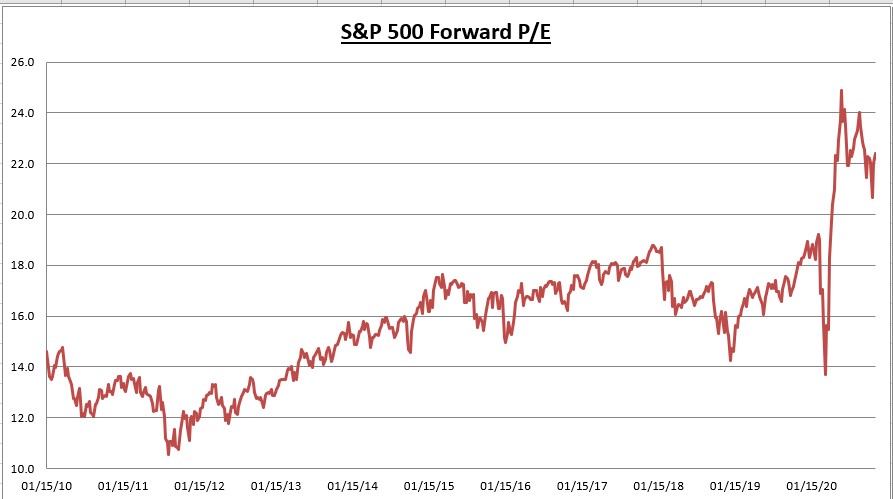
While the forward EPS has risen, the S&P 500 price has risen about 10% in the last two weeks. Friday’s close was a new all-time closing high for the Dow, S&P 500, and Russell 2000. Therefore the price to earnings ratio (PE) has risen to 22.4, which is 25% higher than the 5-year average and 38.5% above the 10-year average.
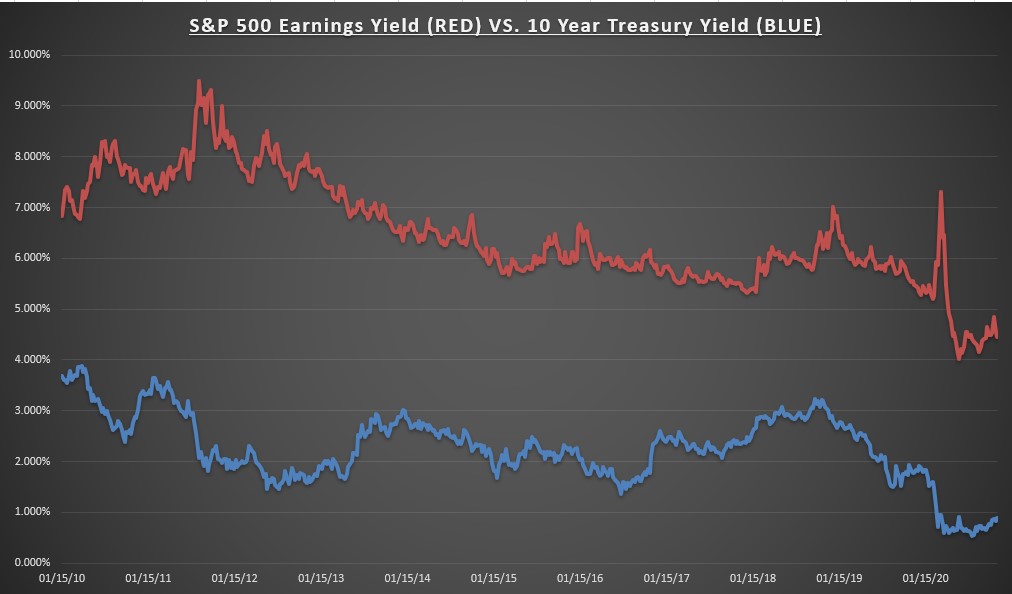
The earnings yield on the S&P 500 has ticked down to 4.46% (again, based upon the 10% increase in the index) while the 10-year Treasury bond rate still hovers below 1.00%.
It’s a consistent theme of contrasting data points that give credence to the bull or bear thesis. Bears look at soaring COVID cases and a high PE ratio, while Bulls look at treatment options that increase the likelihood we can return to normal within the next 12 months, and reasonable valuations when adjusted for low-interest rates. It’s the glass half full or half empty philosophy. Regular readers know I’ve leaned towards the half-full side, and so far the markets have agreed with me.
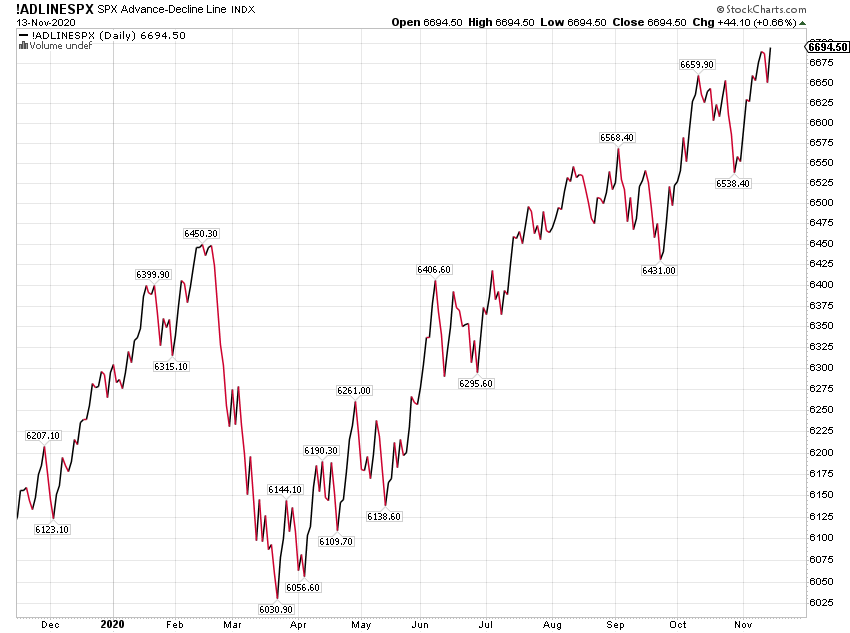
I want to highlight the broad-based nature of this advance. The above chart is the S&P 500 advance-decline line breakout out to new highs.
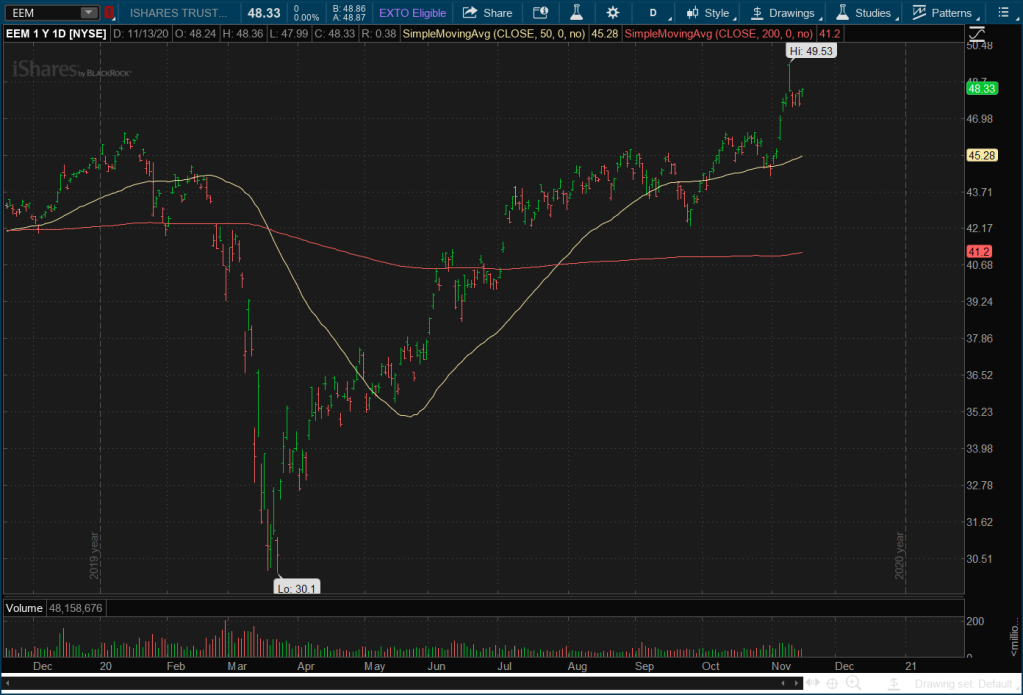
This chart is the emerging markets index fund (EEM) also breaking out to new 52 week highs.
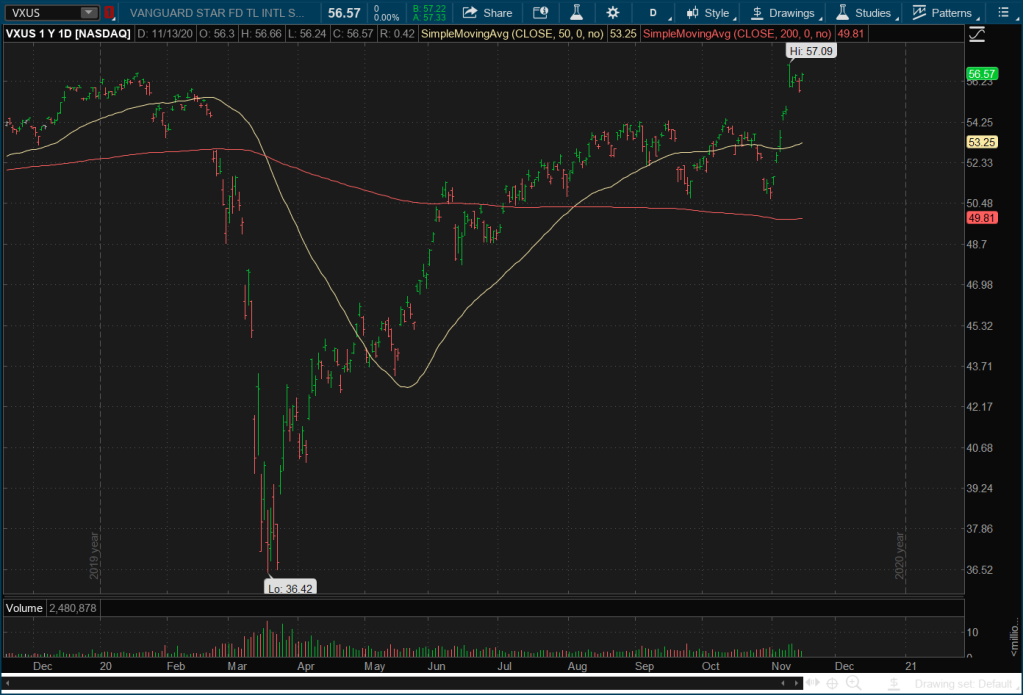
This chart is the international stock index fund (VXUS) also breaking out to new 52 week highs. This is all taking place as the Nasdaq 100 is about 5% below its all-time highs. We were told the markets could never maintain the advancement without the leadership of big tech. The rotation into value, small caps, and international stocks is taking place and the market is still making new highs. Go figure.
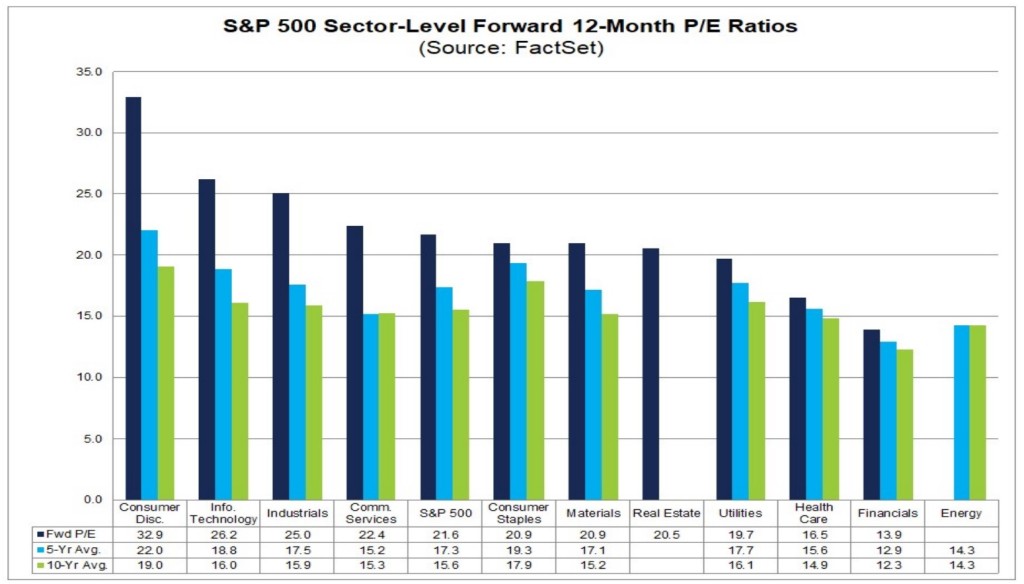
Diversification has been a consistent theme on this blog. I believe in it wholeheartedly. I don’t like crowded trades and I don’t allocate money based upon what has been performing the best. One of the things I look at is valuation on a sector basis. The above chart shows each of the S&P 500 sectors current forward PE against its 5 & 10-year averages. One of the reasons I mentioned my allocation to health care was its valuation against the averages. While the S&P 500 trades 25% and 38.5% above its 5 and 10-year average PE, Health Care currently trades only 5% and 10.7% above its 5 and 10 year PE. Which is the “cheapest” sector relative to each’s 5 & 10-year averages.
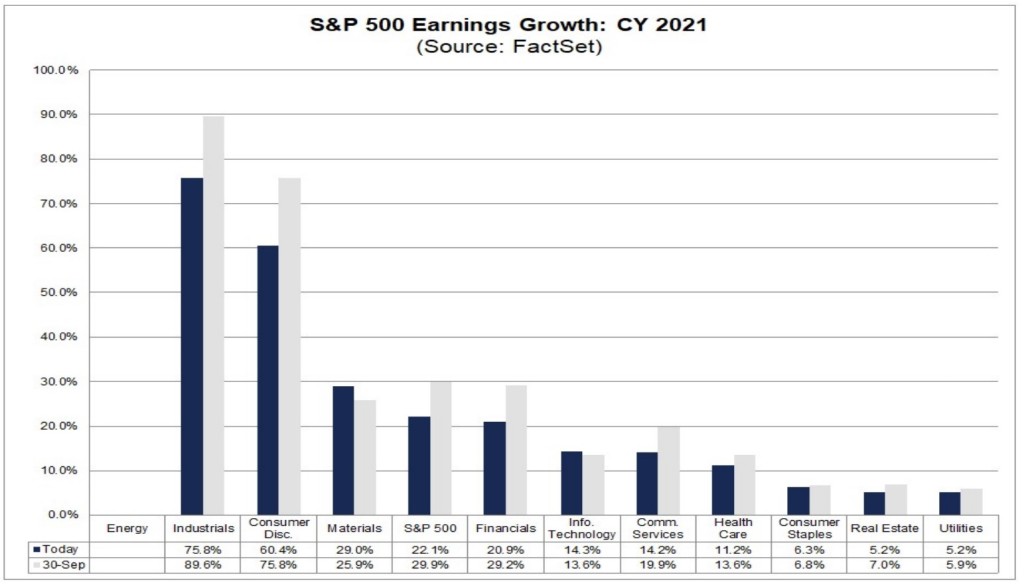
The other very important aspect that I incorporate is the growth rate. A sector may be cheap because its growth rate is low or negative. Based upon 2021 earnings growth and current forward PE estimates, the most attractive sectors are Industrials, Consumer Discretionary, Basic Materials, Financials, Health Care. I’m using the PEG ratio in my analysis.
I still remain overweight on tech but have been taking profits in the sector for the last few months and using the proceeds to move into these other areas of the market in preparation for the potential of a rotation. We’ve seen numerous times were value starts outperforming growth only to revert back to the prior norms. Based upon the financial results of these big tech companies, its hard to see them being taken over by new leadership. But we are in uncharted waters, and the reopening trade presents a plethora of opportunities.
This week we get earnings reports from Home Depot HD, Walmart WMT, Nvidia NVDA, Target TGT, & Intuit INTU. Along with some key economic data points like retail sales and the CB leading economic indicators index.
Disclaimer: None.


