
S&P 3300 – The Bull Vs. Bear Case
We had suggested last week to our PRO SUBSCRIBERS
- Last week, we suggested the current setup, “suggests a bit more rally could occur next week.”
- That remains the case this week.
- We may be at the limits of that rally for now, but given that last week was an extremely light trading week due to the holiday, we will hold until Monday to see what happens next.
- The market is back to very overbought short-term so a bit of a correction is needed to add to our position.
- Short-Term Positioning: Bullish
- Stop-loss adjusted to $275
Monday and Tuesday were indeed a bit sloppy, as shown below, but the “fireworks” started on Wednesday as Jerome Powell said everything possible to ensure Wall Street a “rate cut” in July without actually saying so.
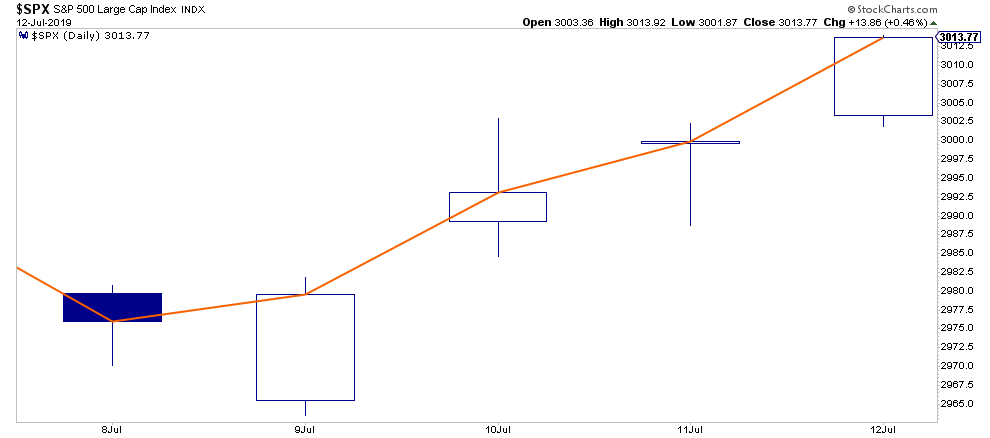
As we will discuss in a moment, almost 18 months after I originally discussed it, the market finally cleared the psychological level of 3000.
That is the good news.
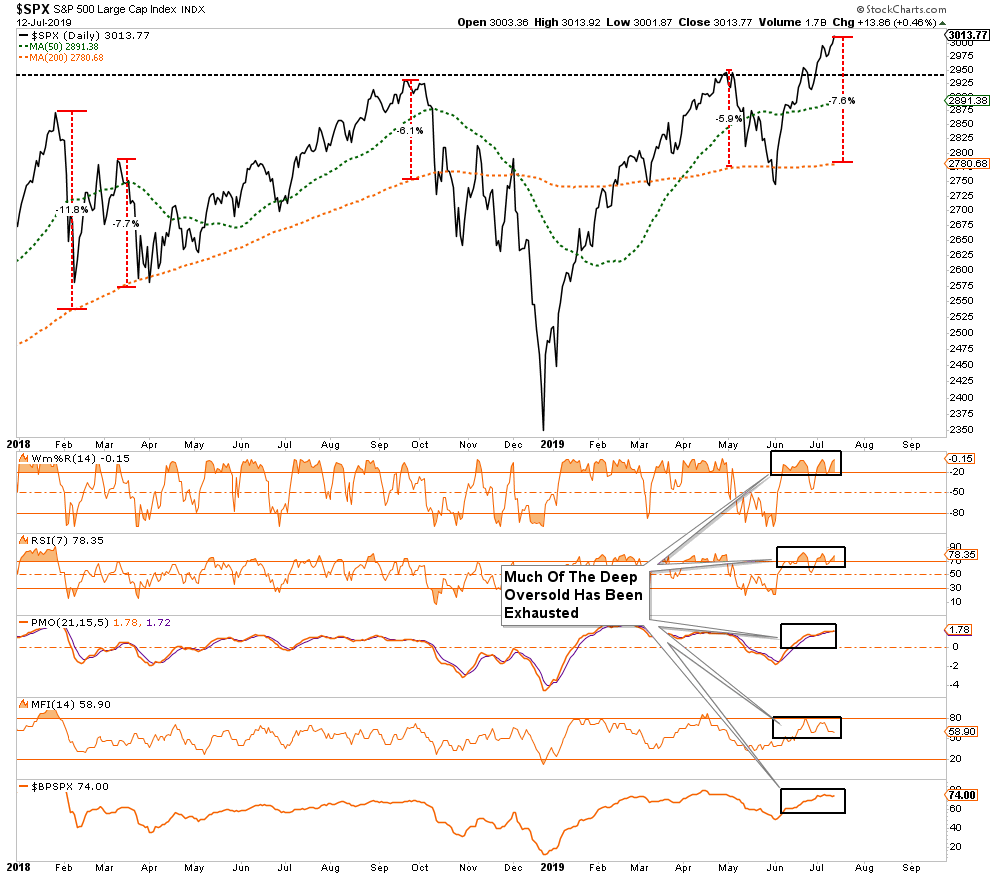
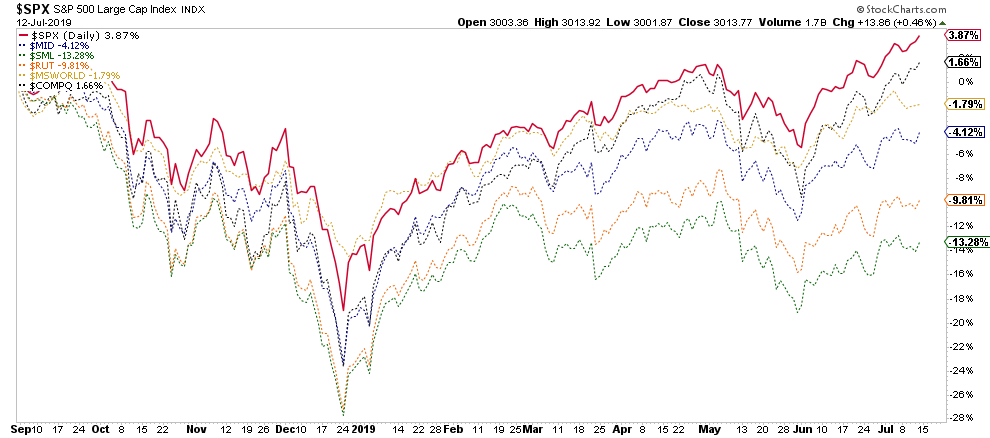
The “not-so-good” news is the market continues to rally into a more extreme overbought condition with a rather extreme deviation above the 200-dma. Also, the negative-divergences in indicators which suggest further upside to the current rally may be limited. In particular, the divergence between small-cap and large-cap performance is typical of periods leading to corrections.
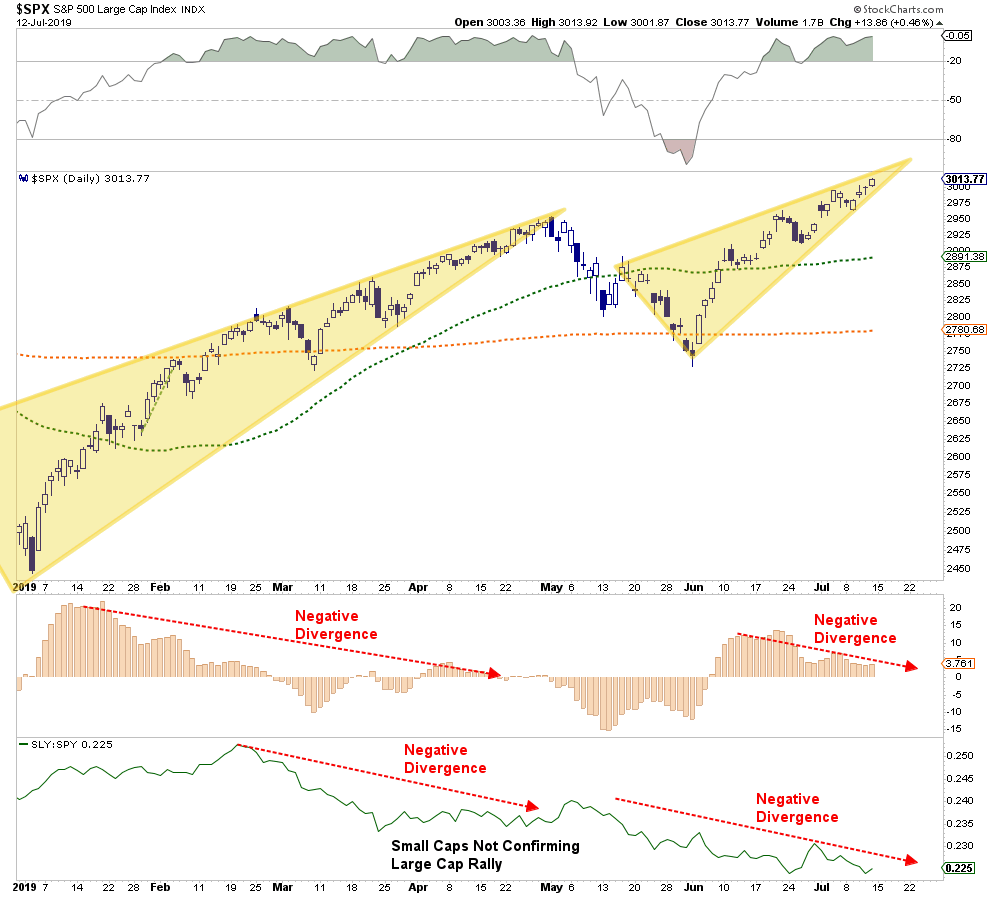
Also, since the September peak in the market, every other major index is lagging the performance of the S&P 500 index which suggests a narrower rally.
With that said, the markets are on a “buy signal,” which suggests further upside is likely in the near-term. This is why we continue to maintain our long-equity bias for now.
However, once we get past the end of the month, and assuming the Fed does indeed cut rates and no “trade deal” with China, the markets will return their focus to economics and earnings. As we said last week, such continues to suggest the August/September time frame for a larger corrective cycle is still in play.
Bonds Retreat
My colleague Patrick Hill asked me to address the retreat in bond prices over the last week or so. While many are assigning a variety of reasons for the recent reversal in rates including a resurgence on inflationary pressures, Central Bank demands, to a lack of buying by foreigners, I think the reason is much more simplistic.
Ever since rates spiked up to 3.25% at the beginning of 2018, we have repeatedly been discussing why rates would fall, and economic weakness and deflation would be the driver. Such has indeed been the case, and our long bets on bonds have paid off nicely.
However, bonds are also a “safety” trade in times of uncertainty. The rotation from “risk” to “safety” has been THE trade since September of last year and rates, as I have discussed over the last several weeks, had become“egregiously” overbought. A correction was inevitable as money began chasing equities on hopes of a Fed rate cut.
However, as shown below, we need to keep the recent reversal in the context of the broader move. It is kind of hard to spot.
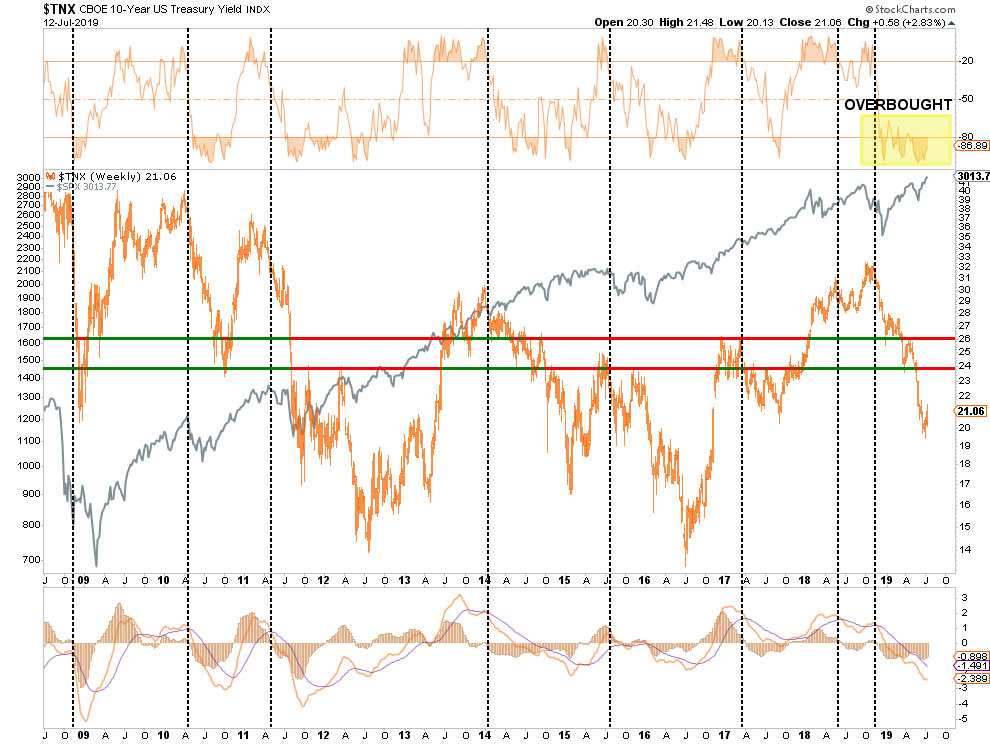
This sell-off in bonds WILL provide another terrific buying opportunity most likely by the end of July. Look for rates to retrace back to previous resistance between 2.4% to 2.6%. Also, it is advisable to increase the duration of bond holdings for the yield curve steepening, which will occur as the economy slips closer to the recession.
That is how we are playing it.
So, let’s talk about S&P 3300.
The Case For 3300
It only took eighteen months longer than expected, but the markets finally reached 3000 on the S&P 500 index this past week.
“What do you mean ‘expected?’ You are always bearish.”
I am just going to save our “reading impaired” individuals some time by reminding them of what I wrote in January of 2018:
“While the record-breaking pace is certainly breathtaking, it should not be surprising as we discussed in the June 9th, 2017 edition of the weekly newsletter.
“Let me state this VERY clearly. The bullish bias is alive and well, and a move to 2500 to 3000 on the S&P 500 is viable.All that will be needed is some piece of legislative agenda from the current administration, which provides a positive surprise. However, without a sharp improvement in the underlying fundamental and economic backdrop soon, the risk of something going ‘wrong’ is rising markedly. The chart below shows the Fibonacci run to 3000 if ‘everything goes right.’”
Of course, that piece of legislative agenda was ‘tax reform.’
With investors now betting on a sharp rise in earnings to reduce the current levels of overvaluation, the seems to be little in the way of the next major milestones for 30,000 for the Dow and 3000 for the S&P 500.”
In March, we followed up that post stating:
“Since that time, tax cuts/reform have been passed, earnings estim+tes have exploded higher, and corporate stock buybacks have surged to record levels while wage growth has remained non-existent for the bottom 80% of workers.
Not surprisingly, with those tailwinds, the market has pushed sharply higher towards our original target of 3000.”
As we know now, the market wound up following our mid-2017 accelerated projection trend.

So, here we are 18 months later, and the market finally hit 3000.
What is interesting, however, is the advance to 3000 incorporated both the original bull and bear projections.
The 20% slide from the September highs came on concerns the Fed was tightening too aggressively as Trump’s “trade war” took a bite out of economic growth and profitability. The subsequent rally back, which brutally reminded investors what “volatility” is, was based on “hope” that Trump would find a resolution with China and the Fed would cut rates.
Neither has happened yet, but the markets remain hopeful.
“But you missed out on the whole rally because you have been all in cash.”
Again, for those that cannot read more than 280-characters at a time:
“Portfolios have remained allocated toward equities, although we did shift to more defensive holdings earlier this year. We had also been aggressive buyers of bonds at 3% and higher on the 10-year bond which has added to portfolio performance this year. “
The Bull & Bear Case
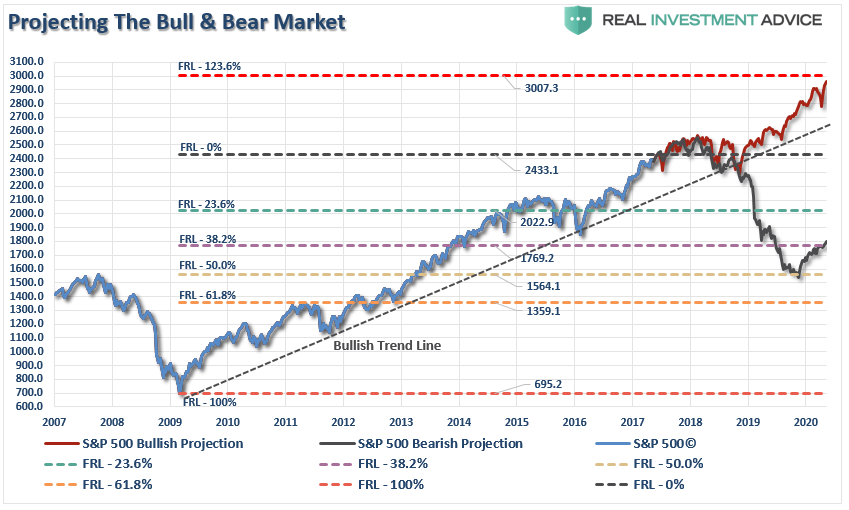
As we face down the last half of 2019, we can once again run some projections on the bull and bear case going into 2021, as shown in the chart below:

Let us break down both potential pathways into the “bull” and “bear” case.
The Bull Case For 3300
- Momentum
- Stock Buybacks
- Fed Rate Cuts
- Stoppage of QT
- Trade Deal
Price momentum has been in control of the markets over the last several months. Given that “an object in motion, tends to stay in motion,” momentum is a hard thing to stop without a bigger event triggering a reversal in investor attitudes.
While Fed rate cuts, and stopping QT, will be seen as “accommodative” to asset prices, the “efficacy” of monetary policy has likely reached its limits. We have a decent understanding this is likely the case given that nearly 100% of all “net new equity purchases” have come from share buybacks in recent years. As I wrote last week:
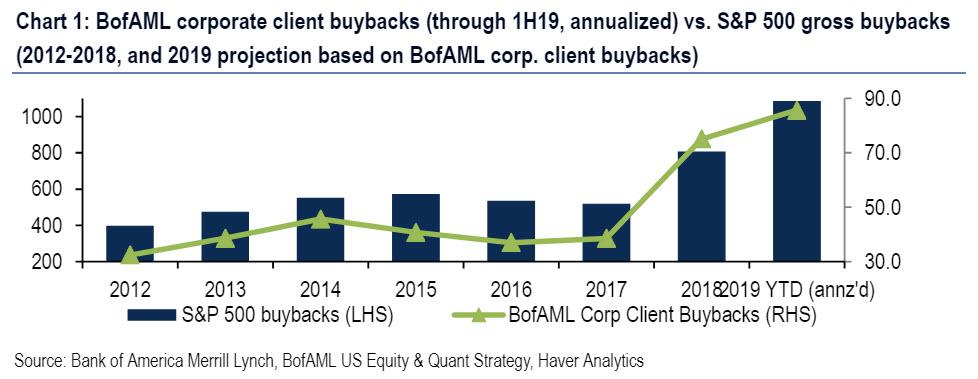
“So, how is it that stocks remain near record highs? The primary culprit, as discussed previously, remains corporate buybacks which remain the primary source of market support in 2019. This is especially the case after US banks announced $129 bn in buybacks over the next 4-quarters.
Buybacks, according to BofA, are on pace for a record at $43B so far this year versus just $75B for the entirety of 2018. This suggests a record of over $1 trillion in S&P 500 buybacks for 2019.”
A “Trade Deal” will also be helpful as it will take the pressure off of bottom-line corporate earnings. As J.P. Morgan’s chief equity strategist Dubravko Lakos-Bujas recently told MarketWatch:
“If you have a trade deal, and if the trade deal coincides with one or two rate cuts from the Fed, we see an upside scenario of 3,200-3,300.”
Yep, the same number we came up with.
However, as investors, we must also analyze what could go wrong and derail our investment strategy. Unfortunately, the “bearish” case has “sharper teeth” to it. (Yes, pun intended.)
The Bear Case Against 3300
- Earnings Deterioration
- Recession
- No Trade Deal/Higher Tariffs
- Credit Related Event (Junk Bonds)
- Mean Reversion
- Volatility / Loss Of Confidence
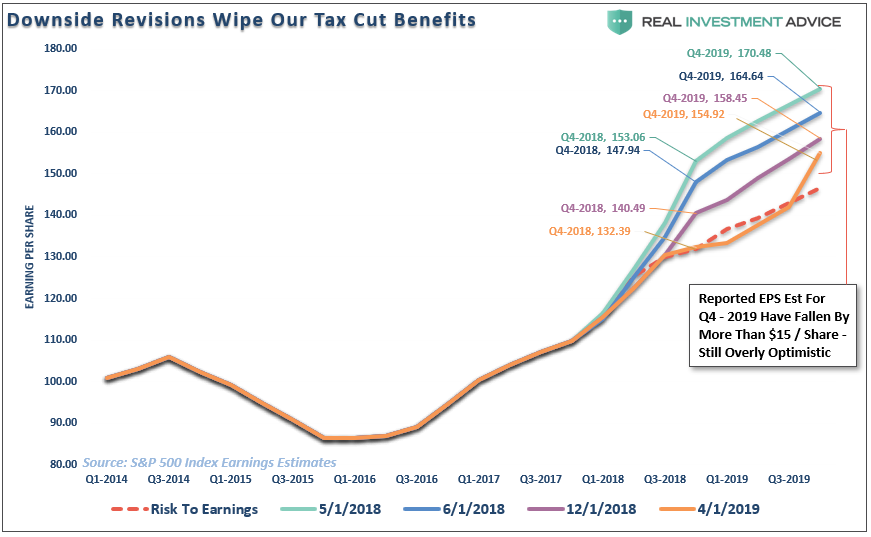
Earnings have already deteriorated markedly since 2018, as I discussed previously.
“However, the red dashed line denotes an 11% reduction to those estimates due to a ‘trade war’ where an across-the-board tariff of 10% on all US imports and exports would lower 2018 EPS for S&P 500 companies and, thus, completely offset the positive fiscal stimulus from tax reform.
Surprise! As of the end of the Q4-2018 reporting period, guess where we are? Exactly 11% lower than where we started which, as stated then, has effectively wiped out all the benefit from the tax cuts.”
Since then, 2019 earnings have been downgraded substantially. As Ian Harnett, chief investment strategist at Absolute Strategy Research recently noted:
“We do not think insurance cuts will be enough, we think earnings growth is not going to be 7% this year, it is going to be -5%, and maybe even -10. We are looking at these recession risk models rising, credit impulse numbers in the states are weak, that tends to bring unemployment up and tends to bring equity markets down.”
Given there has been no “trade deal” as of yet, the increase in tariffs in June to 25% have yet to show up in reports just yet, and global growth slowing, there is an elevated risk of an “earnings recession” currently.
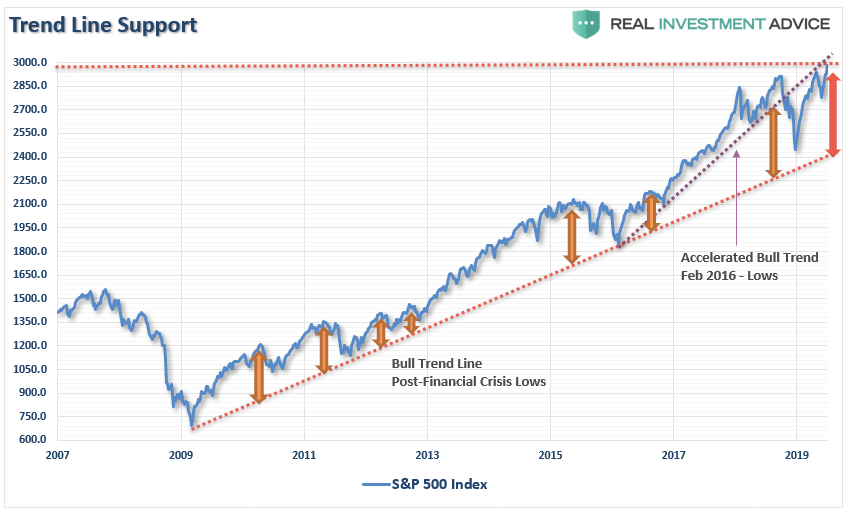
There is also just the simple issue that markets are very extended above their long-term trends, as shown in the chart below. A geopolitical event, a shift in expectations, or an acceleration in economic weakness in the U.S. could spark a mean-reverting event which would be quite the norm of what we have seen in recent years.
Then there are the tail-risks of a credit-related event caused by a dollar funding shortage, a banking crisis (Deutsche Bank), or a geopolitical event, or a surge in defaults on “leveraged loans” which are twice the size of the “sub-prime” bonds liked to the “financial crisis.”(Read more here)
Just remember, bull runs are a one-way trip.
Most likely, this is the final run-up before the next bear market sets in. However, where the “top” is eventually found is the big unknown question. We can only make calculated guesses.
Currently, the “math” suggests there are just 200 points of upside to our next target, but there is roughly 800-points of downside.
Be careful how you bet; these are odds that Vegas would love to give you.
I know. I know.
It is easy to get wrapped up in the bullish advance. However, it is worth remembering that making up a loss of capital is not only hard to do, but the “time” lost cannot.
The point is while the media, and bulk of the commentary continue, to “urge you to ride the bull,” they are not going to tell you when to get off.
Moreover, when the ride does come to an end, the media will ask first “why no one saw it coming?”
Then they will ask “why YOU did not see it coming when it so obvious.”
In the end, being right, or wrong, does not affect the media as they are not managing your money. Nor are they held responsible for consistently poor advice. However, being right, or wrong, has a very big effect on you.
Let me repeat for all of those who continue to insist I am bearish and somehow am missing out on the “bull market” advance:
“While our portfolios remain long currently, we do so with hedges and stops in place, a thorough methodology of analysis, and a strict investment discipline we follow to mitigate the risk of long-biased exposure. In other words, whenever the market does turn, we will sell and move to cash.”
If you are going to “ride this bull", make sure you do it with a strategy in place for when, not if, you get thrown.Tending The Garden
Here are some guidelines to follow.
It is worth remembering that portfolios, like a garden, must be carefully tended to otherwise the bounty will be reclaimed by nature itself.
- If fruits are not harvested (profit taking), they ‘rot on the vine.’
- If weeds are not pulled (sell losers), they will choke out the garden.
- If the soil is not fertilized (savings), then the garden will fail to produce as successfully as it could.
So, as a reminder, and considering where the markets are currently, here are the rules for managing your garden:
1) HARVEST: Reduce “winners” back to original portfolio weights. This does NOT mean sell the whole position. You pluck the tomatoes off the vine, not yank the whole plant from the ground.
2) WEED: Sell losers and laggards and remove them from the garden. If you do not sell losers and laggards, they reduce the performance of the portfolio over time by absorbing “nutrients” that could be used for more productive plants. The first rule of thumb in investing “sell losers short.”
3) FERTILIZE AND WATER: Add savings on a regular basis. A garden cannot grow if the soil is depleted of nutrients or lost to erosion. Likewise, a portfolio cannot grow if capital is not contributed regularly to replace capital lost due to erosion and loss. If you think you will NEVER LOSE money investing in the markets…then STOP investing immediately.
4) WATCH THE WEATHER: Pay attention to markets. A garden can quickly be destroyed by a winter freeze or drought. Not paying attention to the major market trends can have devastating effects on your portfolio if you fail to see the turn for the worse. As with a garden, it has never been harmful to put protections in place for expected bad weather that did not occur. Likewise, a portfolio protected against “risk” in the short-term, never harmed investors in the long-term.
With the overall market trend still bullish, there is little reason to become overly defensive in the very short-term. However, I have this nagging feeling that the “spring” is now wound so tightly, that when it does break loose, it will likely surprise most everyone.
Just something to think about..
THE REAL 401k PLAN MANAGER
A Conservative Strategy For Long-Term Investors

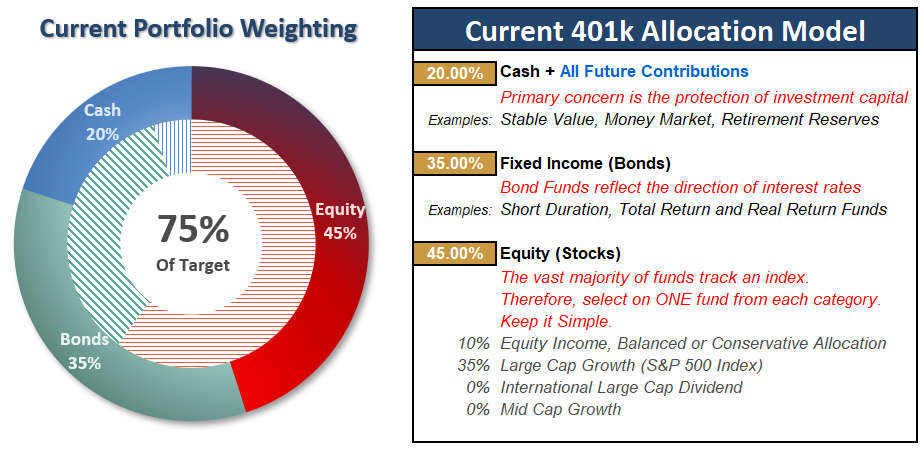
There are 4-steps to allocation changes based on 25% reduction increments. As noted in the chart above a 100% allocation level is equal to 60% stocks. I never advocate being 100% out of the market as it is far too difficult to reverse course when the market changes from a negative to a positive trend. Emotions keep us from taking the correct action.

Fed All But Promises To Cut Rates
Despite stronger than expected inflation and employment numbers, an uptick in economic activity indices, and markets at record highs, Jerome Powell all but promised to cut rates at the end of this month.
Our suspicion is the Fed is either aware of the potential exogenous risk to markets, like Deutsche Bank, and has been called on by the ECB to provide liquidity to the financial markets, or Powell has just completely given up independence to the White House wishes.
Our best guess is the former. If that is indeed the case, there is likely not much the Fed can do to stem the next decline. However, in the meantime, markets are rising, and we need to continue to participate.
With the breakout to new highs and the reaffirmation of our buy signal, we can look to increase exposure to portfolios on any market action that reduces the current extreme overbought condition.
With Q2 reporting season going into full swing next week, as noted above, there is a potential short-term risk to share prices which could provide a better entry point to add to equity exposure. Be patient for that confirmation.
As stated previously, July and August tend to be challenging months for the market, so we want to be careful, particularly with the economic backdrop weakening.
Take the following actions on Monday.
- If you are overweight equities – Hold current positions but remain aware of the risk. Take some profits and rebalance risk to some degree if you have not already.
- If you are underweight equities or at target – rebalance risks, look to increase holdings in domestic equities opportunistically.
With the markets back to extremely overbought conditions, patience will likely be rewarded.
Current 401-k Allocation Model
The 401k plan allocation plan below follows the K.I.S.S. principle. By keeping the allocation extremely simplified it allows for better control of the allocation and a closer tracking to the benchmark objective over time. (If you want to make it more complicated you can, however, statistics show that simply adding more funds does not increase performance to any great degree.)
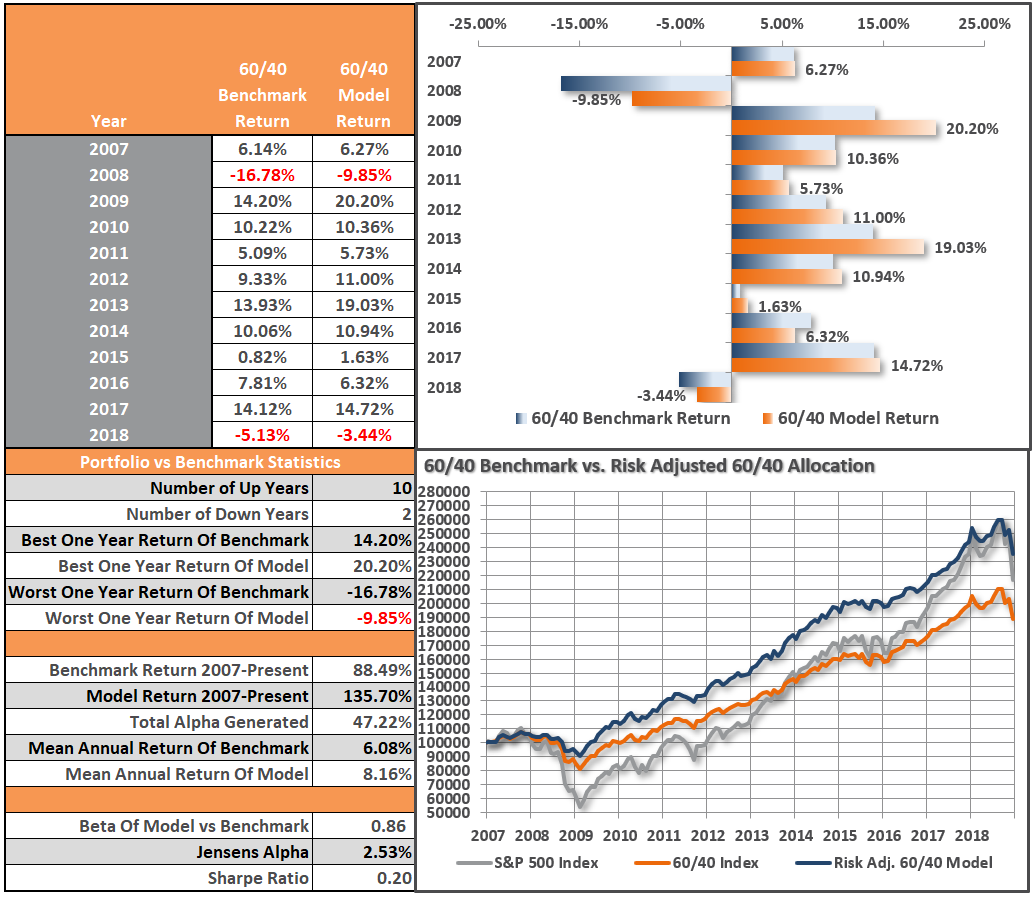
Model performance is based on a two-asset model of stocks and bonds relative to the weighting changes made each week in the newsletter. This is strictly for informational and educational purposes only and should not be relied upon for any reason. Past performance is not a guarantee of future results. Use at your own risk and peril.
Disclosure:
f you are NOT an RIA PRO subscriber you are missing the most important part of each weeks’ ...
more

