
A spate of articles mention the possibility of recession [1] [2]. Here’s the evolution of the 10yr-3mo and 10yr-2yr term spread in the months preceding the last four recessions.
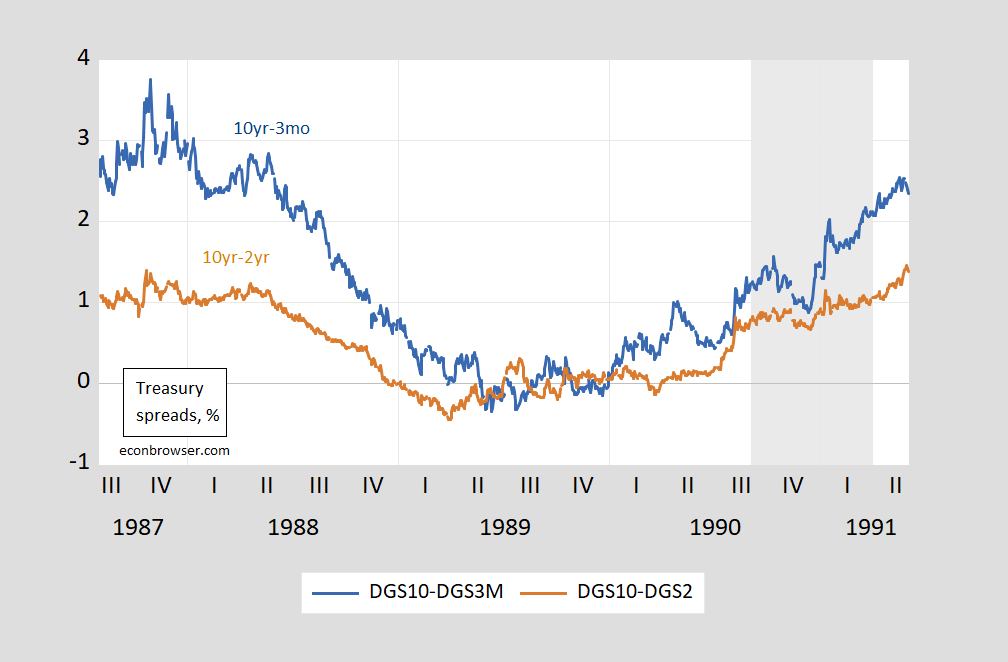
Figure1: Ten year – three month Treasury spread (blue), and ten year – two year Treasury spread (brown), in %. NBER defined recession dates. Source: Treasury via FRED, NBER, and author’s calculations.
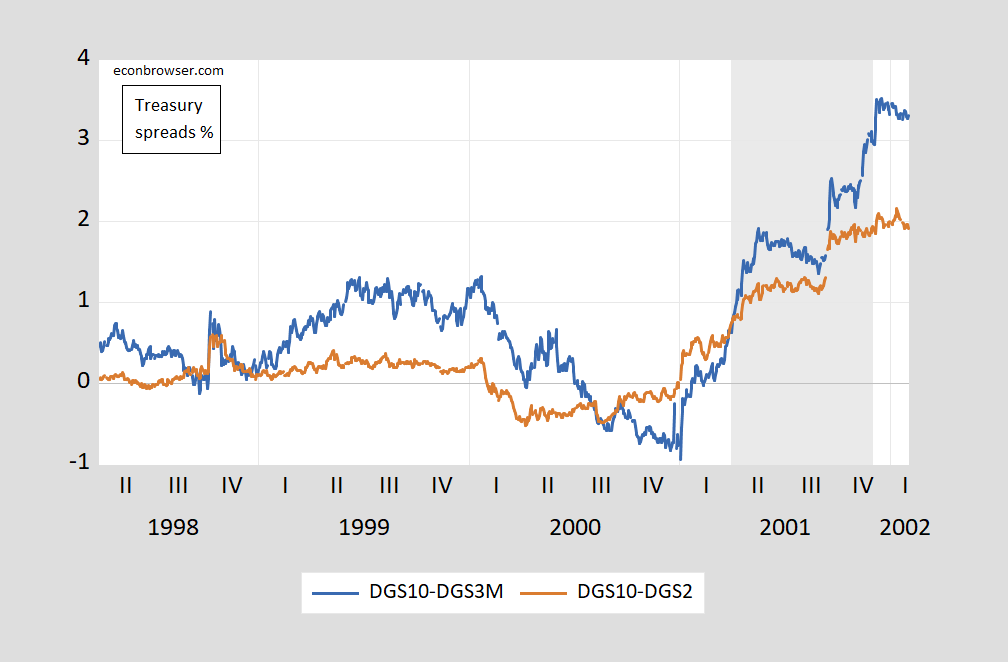
Figure2: Ten year – three month Treasury spread (blue), and ten year – two year Treasury spread (brown), in %. NBER defined recession dates. Source: Treasury via FRED, NBER, and author’s calculations.
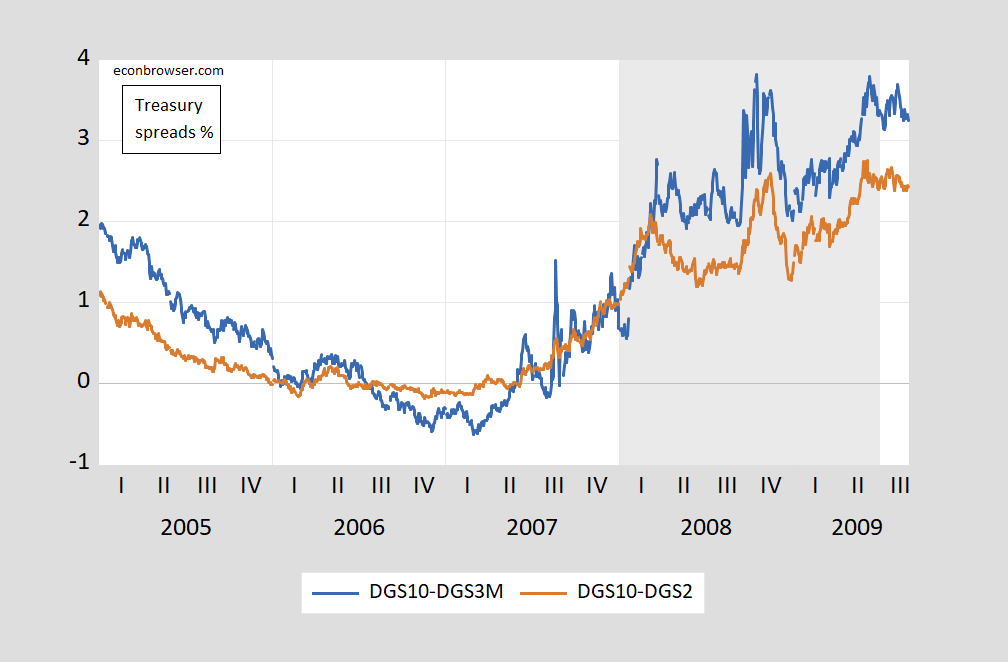
Figure 3: Ten year – three month Treasury spread (blue), and ten year – two year Treasury spread (brown), in %. NBER defined recession dates. Source: Treasury via FRED, NBER, and author’s calculations.
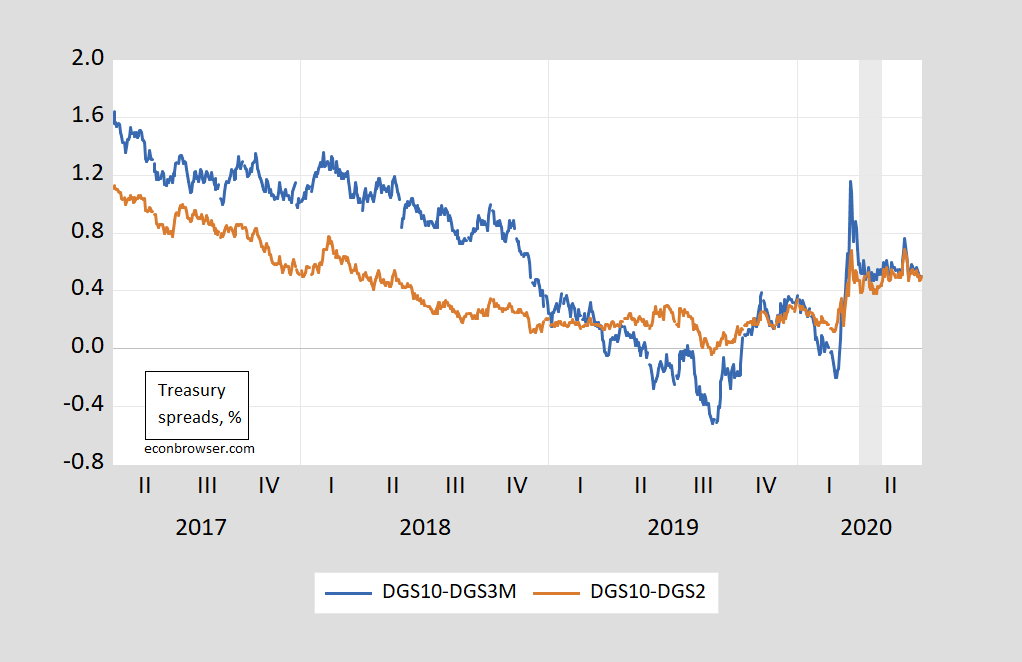
Figure 4: Ten year – three month Treasury spread (blue), and ten year – two year Treasury spread (brown), in %. NBER defined recession dates. Source: Treasury via FRED, NBER, and author’s calculations.
We don’t know when the next recession will begin, but we do know where spreads are as of today? That’s shown in Figure 4 below.
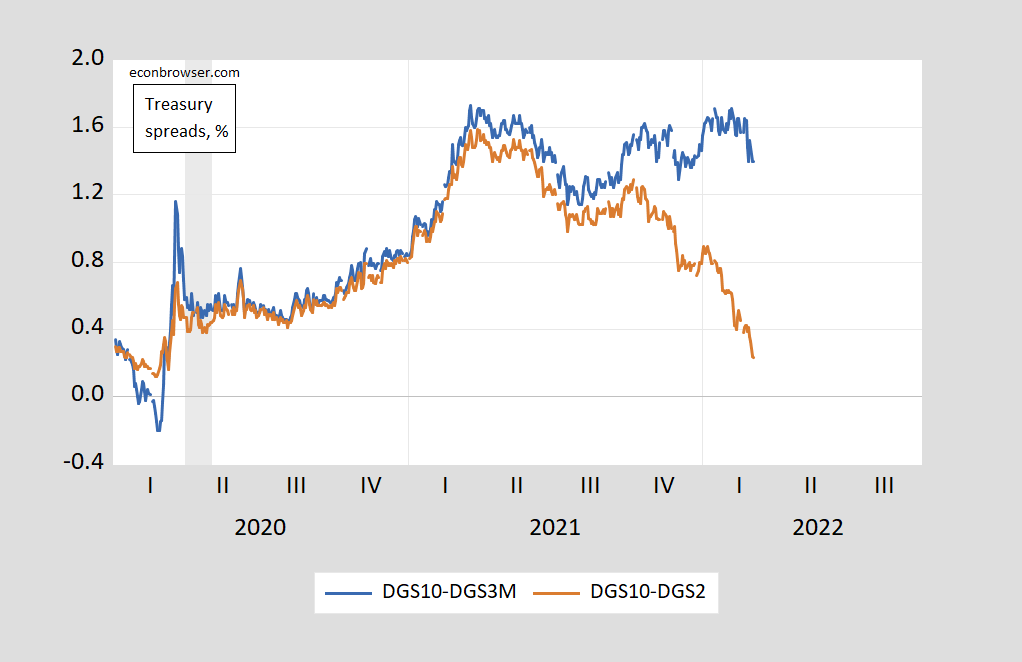
Figure 5: Ten year – three month Treasury spread (blue), and ten year – two year Treasury spread (brown), in %. NBER defined recession dates. Source: Treasury via FRED, NBER, and author’s calculations.
While the 10yr-2yr spread is falling quickly, the 10yr-3mo spread remains at non-alarming levels.
Torsten Slok notes that sharp increases in gasoline prices presage recessions.
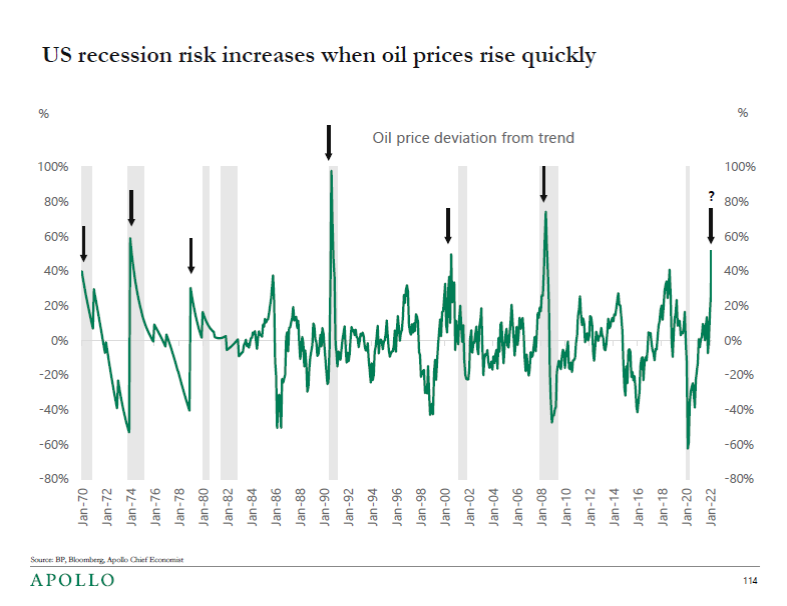
Source: Torsten Slok/Apollo, March 5, 2022.
As for inflation expectations, 5-year inflation breakevens indicate an upward movement. However, adjusting for estimated real and liquidity premia suggests no acceleration of expected inflation (at least through the end of February).
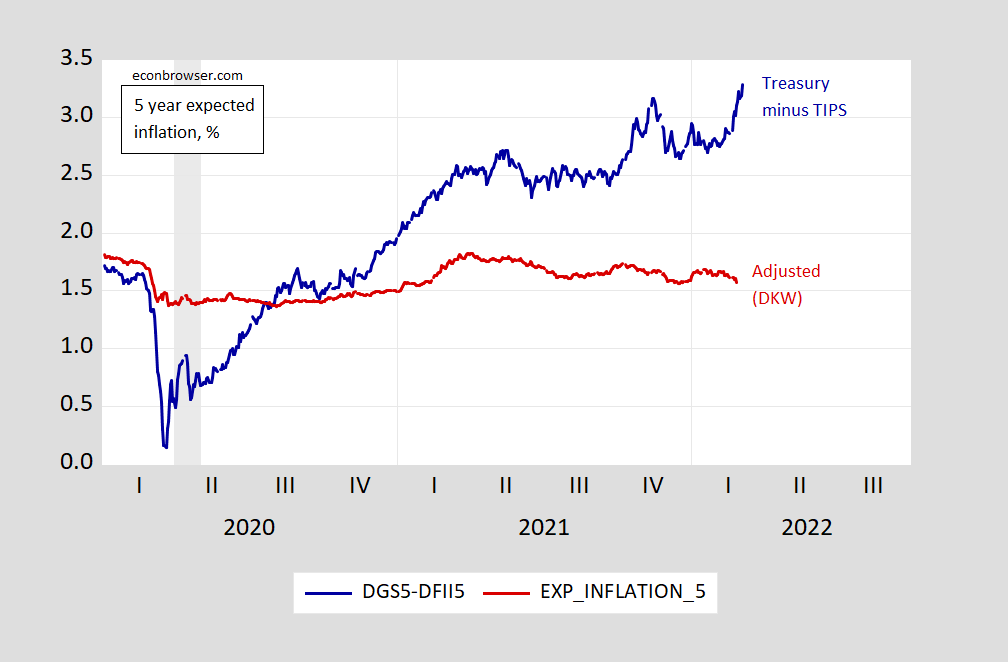
Figure 6: Five year Treasury yield minus five year TIPS yield (blue), and five year expected inflation (brown) Source: Treasury via FRED, Kim, Walsh and Wei (2019) following D’amico, Kim and Wei (DKW) accessed 3/7/2022, and author’s calculations.
Despite the anxieties about higher inflationary pressures arising from higher commodity prices, market-implied short rates 2-3 months ahead have declined.
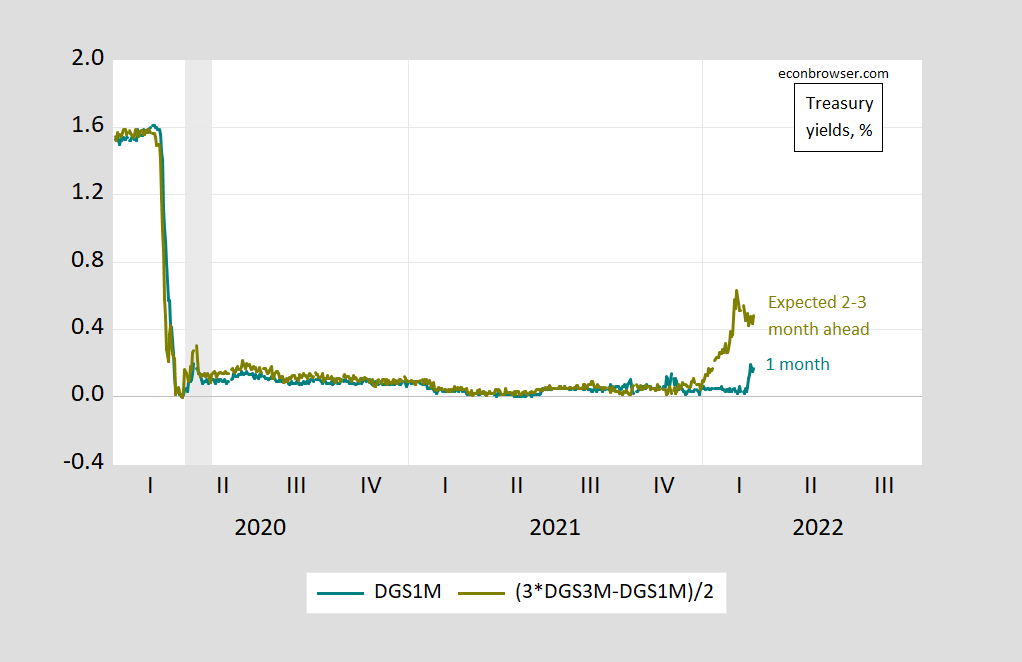
Figure 7: One month Treasury yield (teal), and implied yields 2-3 months ahead (chartreuse), in %. NBER defined recession dates. Source: Treasury via FRED, NBER, and author’s calculations.


Comments
Log in or sign up to join the conversation.