

Image Source: Unsplash
10Y US Notes is in the recovery mode, while US yields are turning lower and that's why we see USdollar Index - DXY with a bearish price action and there's room for more weakness if we take a look at DXY/ZN Ratio Chart (USDollar Index against 10Y US Notes).
As you can see below, DXY/ZN Ratio Chart is making a larger (A)(B)(C) zig-zag correction and after recent three-wave ABC corrective recovery in wave (B), it's now in free fall for wave (C) that can drop the price all the way back to 2023 lows, so USDollar and US yields could easily stay under bearish pressure, while 10Y US Notes can stay on the rise.
(Click on image to enlarge)
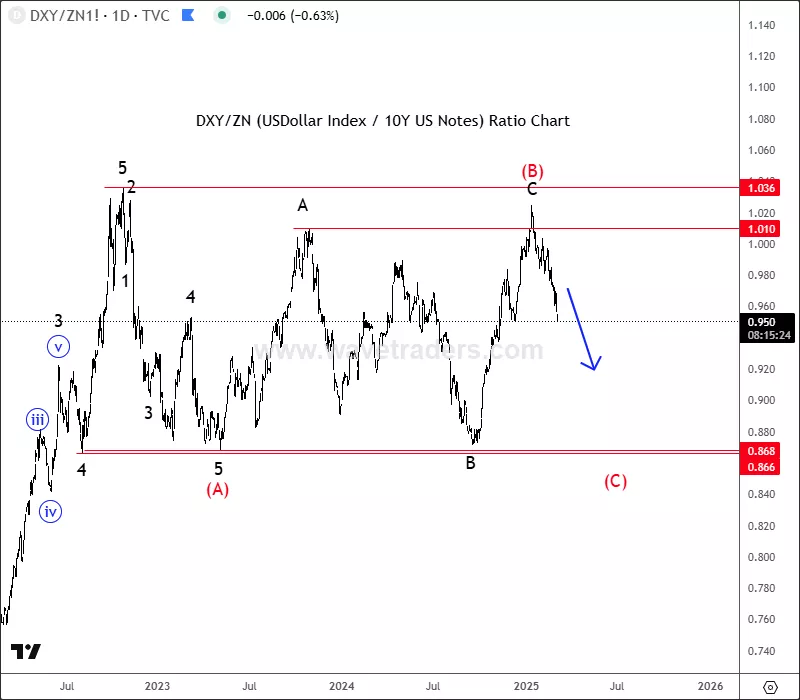
DXY/ZN Daily Ratio Chart
More By This Author:
Stocks Are Trying To Stabilize Within A Triangle
Bitcoin Cash Could Be In Final Stages Of A Correction
BlackRock Bitcoin ETF Is At Key Support


Comments
Log in or sign up to join the conversation.