Price Analysis: Will $1900 Hold?
The price analysis last month highlighted how gold was trying to carve out fragile support around $1900 and breakthrough resistance at $1950.
Gold found a spark and broke through $1950, but has been unable to hold above it in the wake of “hawkish” Fed comments. $1900 is being tested and should give clues to the next move. So far, it has held with only a slight dip into the $1800s before recovering. A hard bounce here would prove near-term bullish, but if the price breaks down below $1880 it could be a few more months until gold musters the strength to take on $2000 again.
$2000 will almost certainly fall once the market realizes the Fed is bluffing. After all, if they were to get rates to 3% by year-end, annualized interest on the $4T Treasury Bill balance would surge by over $120B within a few months. It won’t take long for the interest on Notes to also increase by over $100B considering the $13.4T balance is currently financed at a rate of 1.35%.
While near-term momentum has been lost, the bullish breakout that occurred after gold broke through $1800 remains intact.
Resistance and Support
Gold
Gold failed at $2000 and also failed to hold above $1950. Sentiment has turned very negative and $1900 has now become the new battleground with $1880 offering some support with greater support at $1850. Minor resistance sits once again at the old all-time high from 2011: $1915. While gold is very oversold, it could remain under pressure until the next Fed meeting when the rumor of a 50bps increase becomes fact.
Outlook: Short-term bearish beyond an oversold bump
Silver
Silver has also broken down, falling below $24. The major resistance of $25 continues to give silver problems. Every breakout is followed by a subsequent breakdown. Silver has fallen a bit more than gold in the recent sell-off which could mean it’s closer to a bottom. That being said, it is still lacking any near-term catalyst to reclaim the ground that’s been lost.
Outlook: Bearish
(Click on image to enlarge)
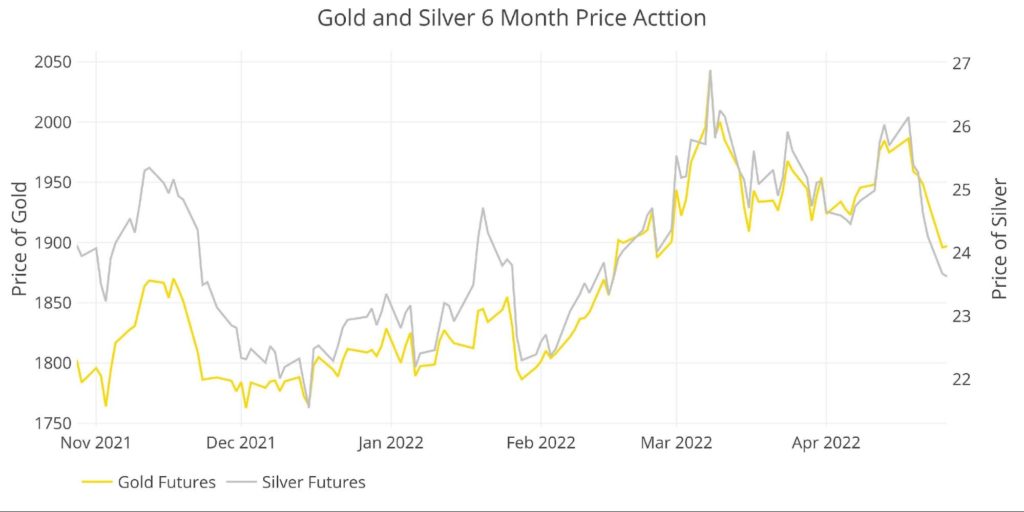
Figure: 1 Gold and Silver Price Action
Daily Moving Averages (DMA)
Gold
The 50 DMA has pulled away from 200 quite strongly. However, the current price is now below the 50 DMA of $1937 but still sits comfortably above the 200DMA of $1833. As shown in the chart, the 50 DMA likes to test the 200 DMA frequently throughout a bull trend. This suggests near-term bearishness in an otherwise long-term bullish trend.
Outlook: Short term bearish in a bull market
(Click on image to enlarge)
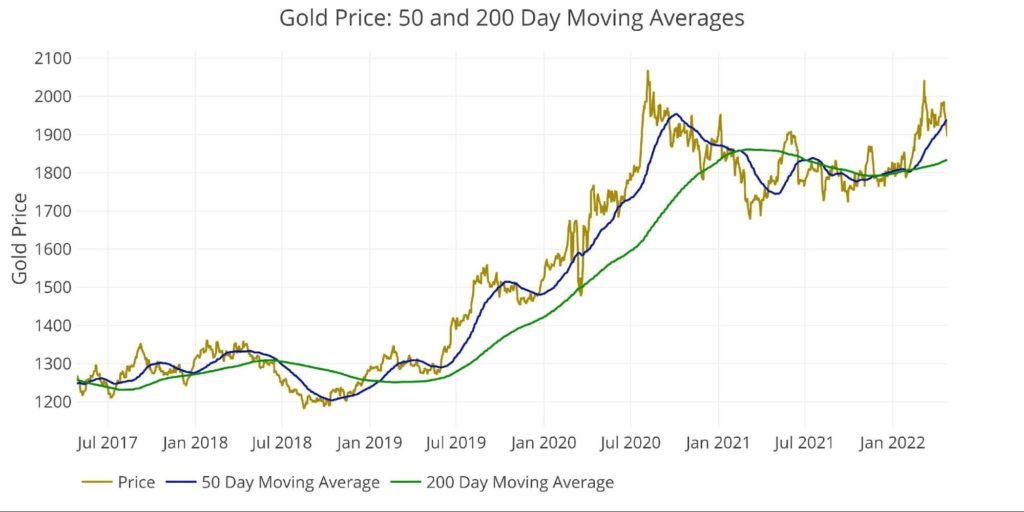
Figure: 2 Gold 50/200 DMA
Silver
The silver 50 DMA finally broke through the 200 DMA back on March 23. This formed a golden cross which is typically a bullish sign. Unfortunately, current prices fell back below the 200DMA. This will drag the 50DMA back down unless the price can turn around quickly.
There have been many false breakouts in years past and a golden cross has not been able to give silver the momentum it needs to get traction. That being said, a golden cross is considered bullish.
Outlook: Cautiously bullish
(Click on image to enlarge)
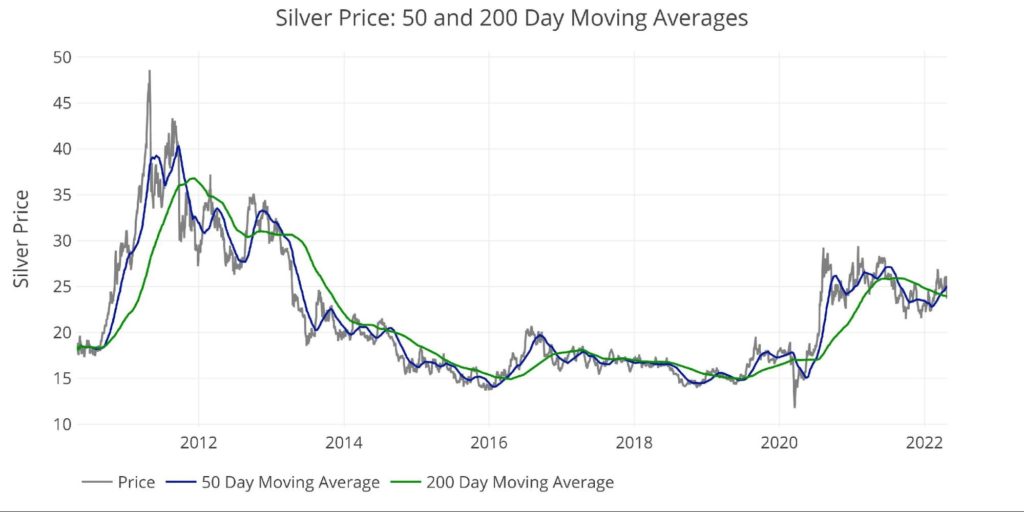
Figure: 3 Silver 50/200 DMA
Comex Open Interest
The two charts below show the open interest compared to the price of both gold and silver. The overlap is not perfect, but major moves in one generally occur in tandem with the other as speculators push and pull the price around with paper contracts.
Gold
Open interest is 90k below the recent high of 645k contracts. This indicates that a good deal of profit-taking has already occurred. Given this dramatic reduction, the gold price held up fairly well until the trap door opened yesterday. There are still about another 50k-60k contracts remaining to bring open interest back to the 500k level which is where the last major consolidation pattern took place between $1750-$1800.
Traders now have more dry powder and $2000 was breached with relatively little increase in open interest last week. This indicates there could a big rally if gold can bring in the recently departed capital. Sitting between the low and high leaves this indicator neutral with a slightly bullish lean.
Outlook: Neutral
(Click on image to enlarge)
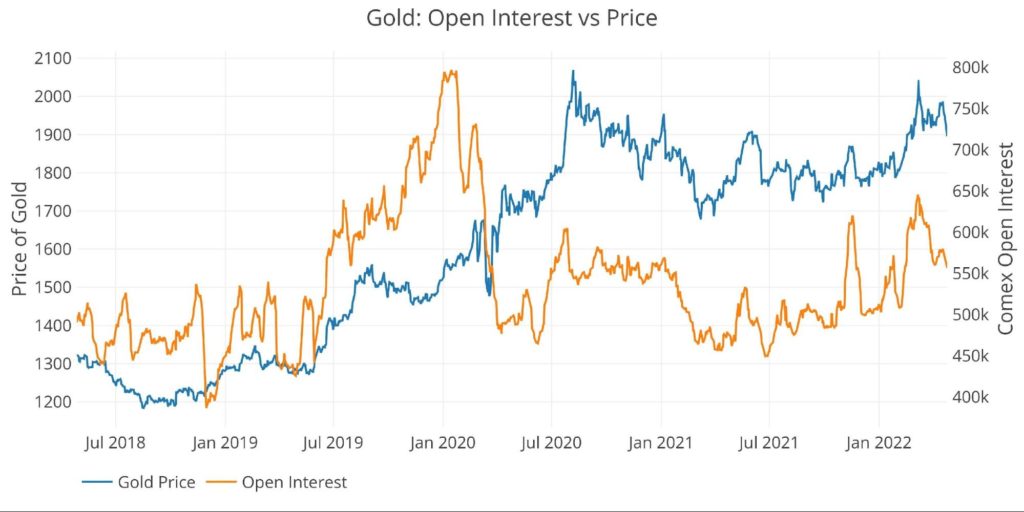
Figure: 4 Gold Price vs Open Interest
Silver
Silver has seen a recent uptick in open interest. The price surge early last week brought open interest to the highest point since June 2021. Open interest then fell by 20k contracts in a few days; however, open interest is still 16k above the December lows. Prices reflect the middle of the same zone (halfway between last week’s high and December lows), which makes this indicator neutral as well.
Outlook: Bearish
(Click on image to enlarge)
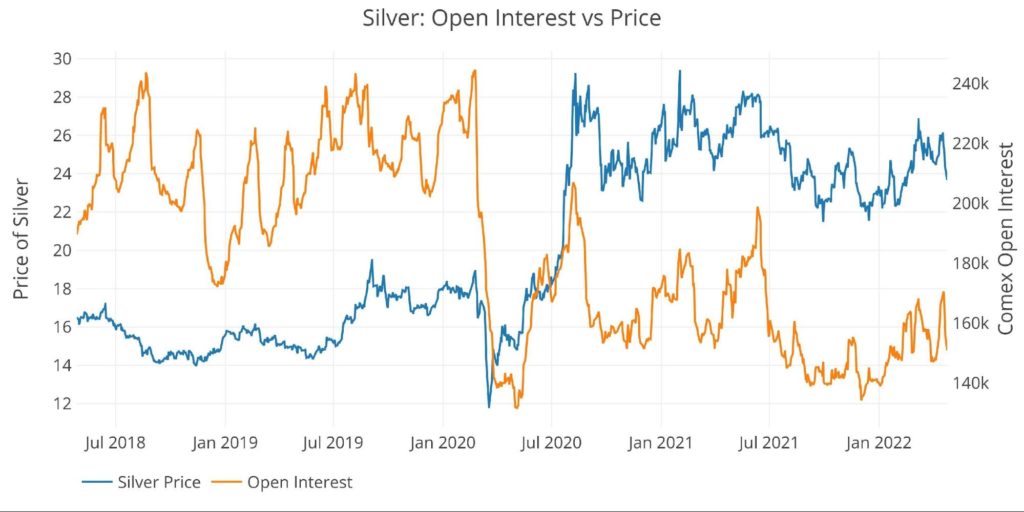
Figure: 5 Silver Price vs Open Interest
Margin Rates
Gold
Margin rates have stayed flat ever since they were raised to $7200 in the wake of the massive price surge in March. This means margin has had zero impact on the price volatility. Furthermore, the CME still has plenty of room to raise margin rates to blunt any price move. Had the recent price decline been coupled with a margin raise, that would leave this bullish. With plenty of room to move up, this is bearish.
Outlook: Bearish
(Click on image to enlarge)
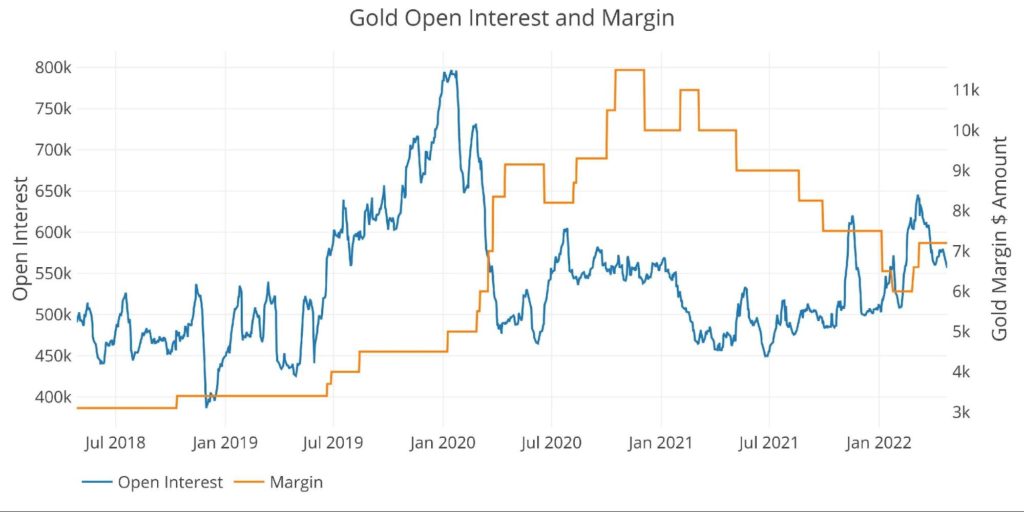
Figure: 6 Gold Margin Dollar Rate
Silver
Silver rates were actually lowered from $9500 to $8500 last week as the price was crashing. This did very little to halt the down move which makes this a very bearish indicator.
Outlook: Bearish
(Click on image to enlarge)
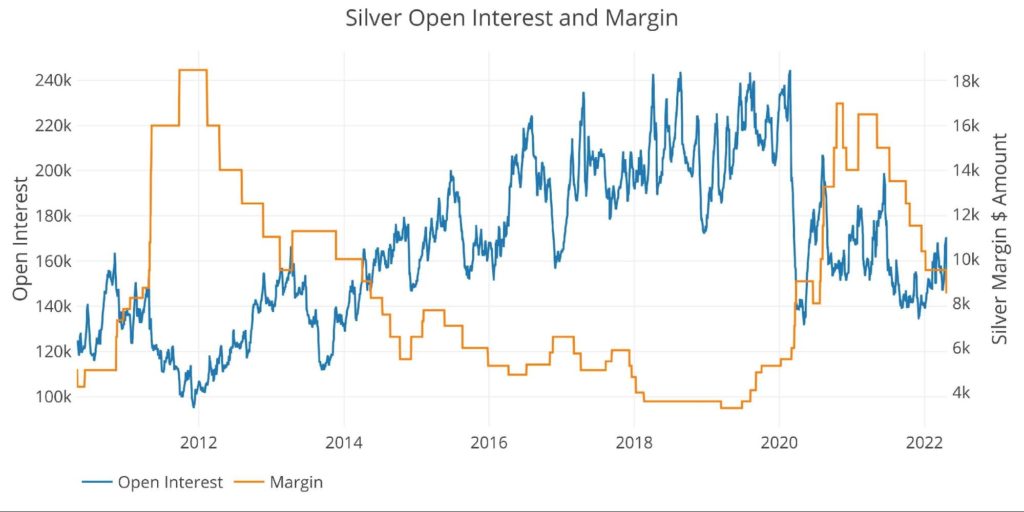
Figure: 7 Silver Margin Dollar Rate
Gold Miners
The price movement in mining companies tends to precede a move in the metal itself. The GDX was leading gold up and even reached a new near-term high above $41 before getting absolutely crushed to below $36 within a few days. The $35 marker should provide some support otherwise the GDX could crash down to $30.
This massive sell-off actually happened with a much smaller move in gold. This can be seen in the steep drop in the blue line below. This shows stock traders anticipating future weakness in gold. The GDX has been very accurately forecasting the next move in gold. Given the sell-off in gold on Monday, the price action last week in GDX once again foretold the Monday sell-off.
(Click on image to enlarge)
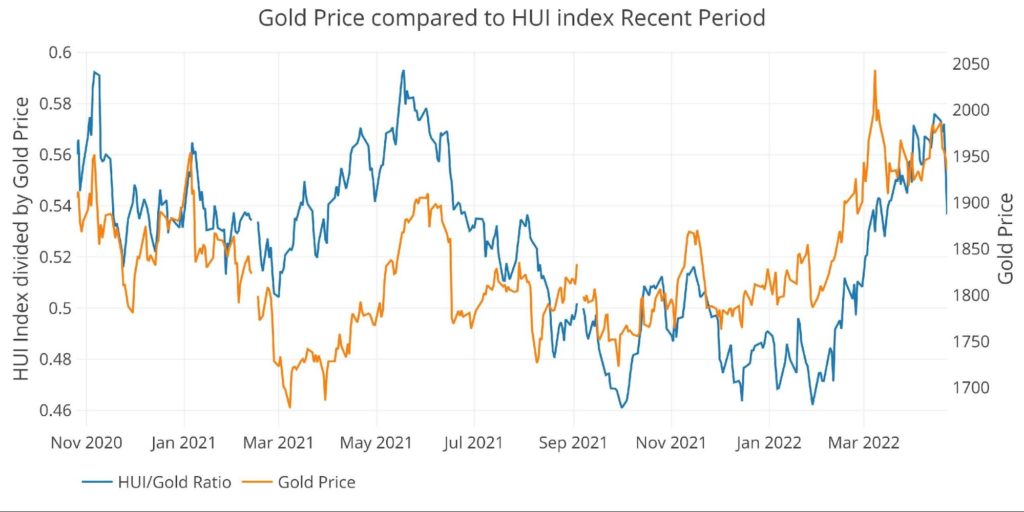
Figure: 8 HUI to Gold Current Trend
Zooming out shows how the miners have fallen way behind the metal. This could be driven by a combination of value stocks under-performing growth stocks alongside significant skepticism in the gold market.
In the short term, the current activity of the miners suggests gold could be on the verge of another decline. It will take a significant boost to undo the damage done last week from a technical standpoint. $40 has been major resistance and the GDX failed miserably at this level.
Outlook: Bearish
(Click on image to enlarge)
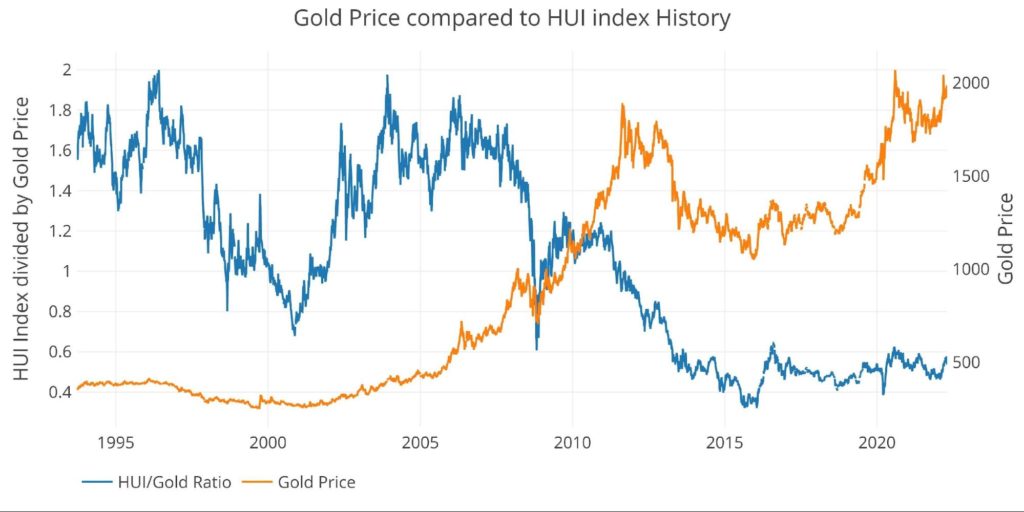
Figure: 9 HUI to Gold Historical Trend
Trade Volume
Love or hate the traders/speculators in the paper futures market, but it’s impossible to ignore their impact on price. The charts below show more activity tends to drive prices higher.
Trade volume in gold fell off a cliff last two weeks. The gold price held up fairly well but eventually broke down through $1900 on higher trade volume. Volume is definitely closer to the bottom than the top which suggests the downside could be limited.
In silver, the opposite is true. Volume has surged recently and could collapse in the weeks ahead if interest dries up. This could create a vacuum of liquidity and bring prices down.
Outlook: Slightly bullish in gold and bearish in silver
(Click on image to enlarge)
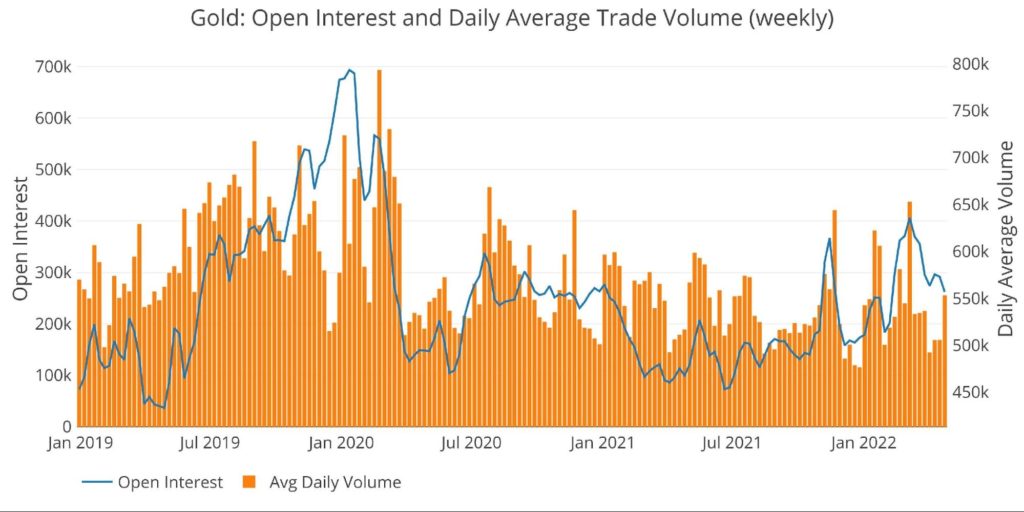
Figure: 10 Gold Volume and Open Interest
(Click on image to enlarge)
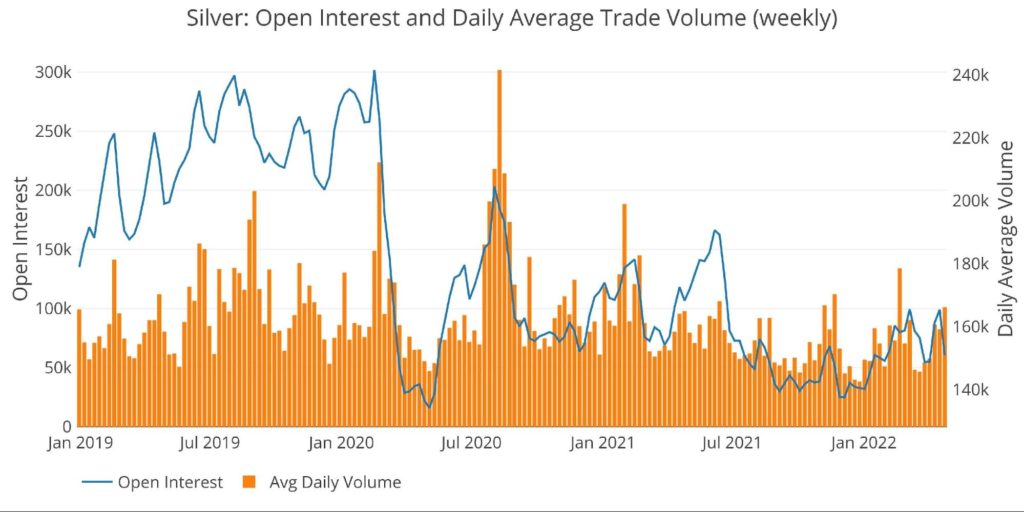
Figure: 11 Silver Volume and Open Interest
Other drivers
USD and Treasuries
Price action can be driven by activity in the Treasury market or the US Dollar exchange rate. A big move up in gold will often occur simultaneously with a move down in US debt rates (a move up in Treasury prices) or a move down in the dollar.
Please note: IEF is the 7-10-year iShares ETF (a move up represents falling rates) and the Dollar return is inverted in this chart to show a positive correlation. They are also plotted on the right y-axis to better show the price movement.
(Click on image to enlarge)
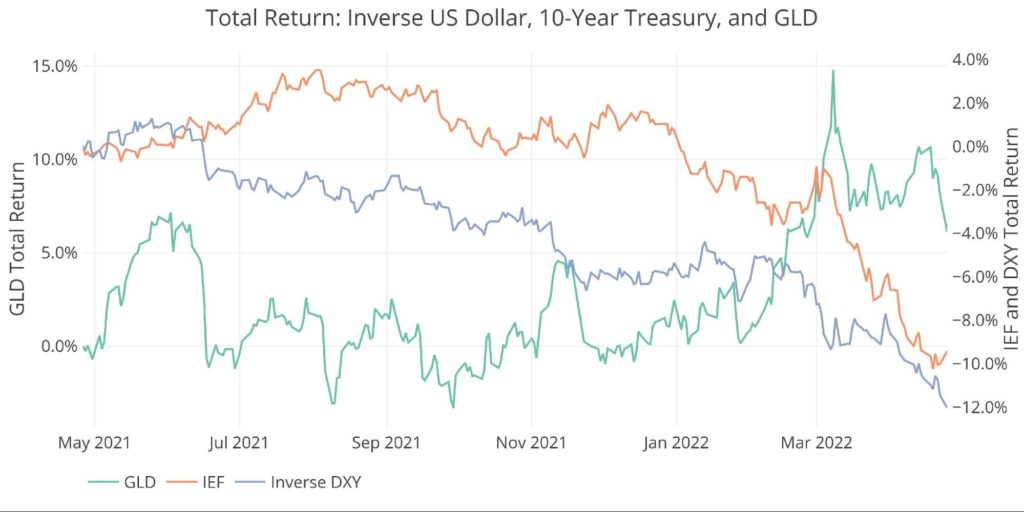
Figure: 12 Price Compare DXY, GLD, 10-year
The first part of April saw a major diversion from the trend as gold and the dollar rallied together and bonds fell. This meant gold was an outlier deviating from the other two. This was a bearish sign at the time and proved true as gold reversed.
To see gold begin rising again, the dollar will most likely need to weaken. Its unlikely bonds will rise with the Fed charting an aggressive course. The headwind of higher interest rates will need to be offset by a weaker dollar. The dollar should be close to a top given the massive inflation; however, the dollar remains the flight to safety currency.
Until the DXY sees a broader sell-off it could cap gold prices. It’s unlikely the dollar can keep rallying so it’s very possible the negative impacts of a high dollar have already been built-in. This will create a major tailwind for gold if and when the dollar turns. For now, that does not seem imminent.
Outlook: Neutral
Gold Silver Ratio
Gold and silver are very highly correlated but do not move in perfect lockstep. The Gold/Silver Ratio is used by traders to determine relative value between the two metals. Historically, the ratio averages between 40 and 60, so outside this ban can indicate a coming reversion to the mean.
Silver is still very cheap relative to gold.
Outlook: Silver Bullish relative to gold
(Click on image to enlarge)
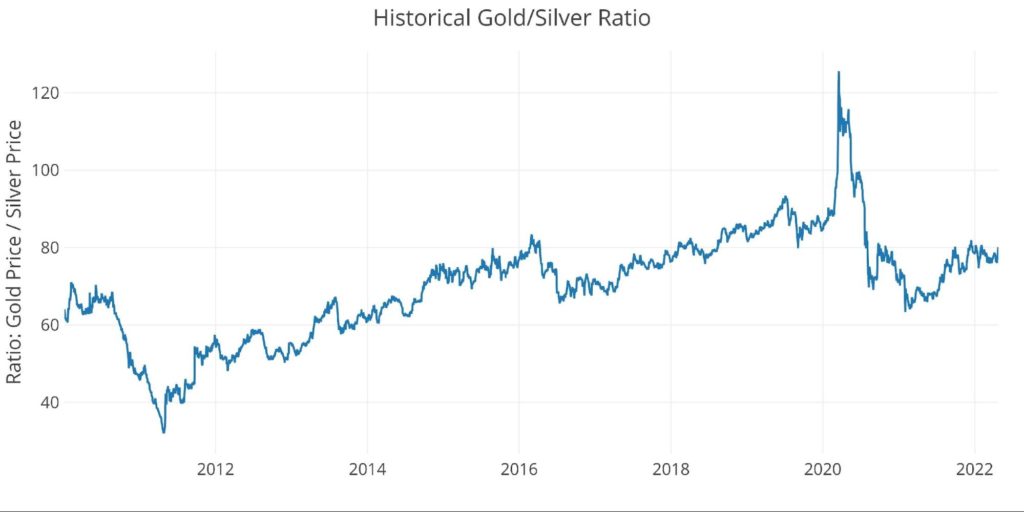
Figure: 13 Gold Silver Ratio
Bringing it all together
The table below shows a snapshot of the trends that exist in the plots above. It compares current values to one month, one year, and three years ago. It also looks at the 50 and 200-daily moving averages. While DMAs are typically only calculated for prices, the DMA on the other variables can show where the current values stand compared to recent history.
The charts above show a complex picture of competing forces, with most indicators pointing towards a near-term bearish stance.
The table below does suggest that gold might be closer to a bottom than silver though:
- Every measure in gold is below the same point a month ago
- Current values are also below their 50 DMAs but comfortably above 200 DMAs
- This clearly indicates momentum has been lost, but the recent up move is still in place (for now)
- Silver is more of a mixed bag with half the indicators above and the other half below one month ago and the 50 DMA
- The 3-year comparison is very interesting. Prices are 58% higher despite much lower open interest
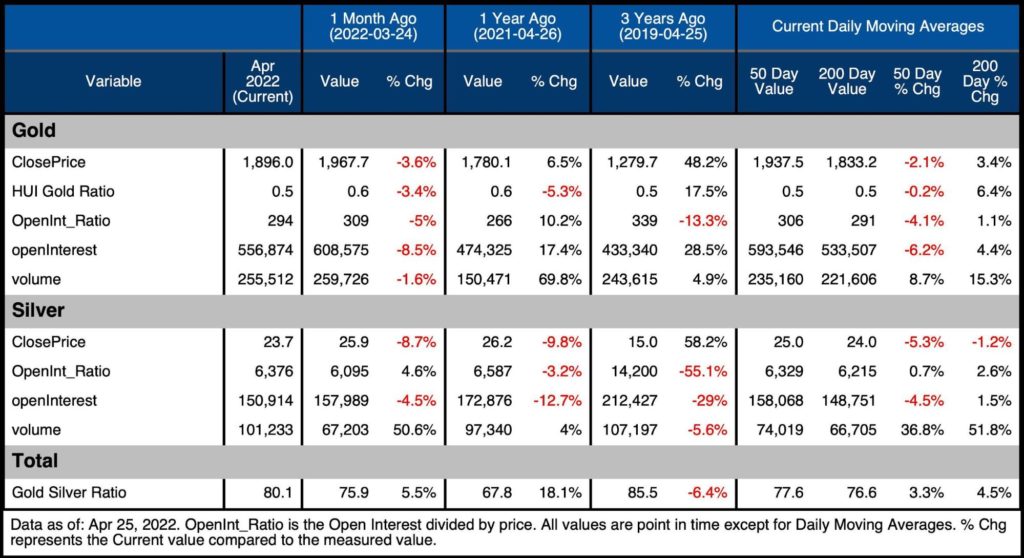
Figure: 14 Summary Table
Wrapping up
Most precious metals investors should be thinking long term and not get caught up in the daily or even monthly movements in gold and silver. The fundamental picture could not be stronger as laid out in the Exploring Finance series. That being said, this analysis attempts to explain some of the more short-term movements in the market that may have frustrated long-term investors.
The technical backdrop suggests the medium-term uptrend is still in place but there is still near-term downside risk. A break below $1850 in gold would be worrisome. Right now, the market still believes the Fed so hawkish comments are weighing on prices along with a very strong dollar. Unfortunately for the Fed, the math is quite clear and they will have a hard time getting rates up to 3% without major negative consequences.
As Peter Schiff continues to say, this will be enough to pop the bubble, but not enough to bring down inflation. This is why the Fed has to talk so aggressively to try and bring down inflation expectations. They can’t really do anything. Once they return to stimulating the economy, gold and silver could go parabolic. This is also when the futures price could really deviate from the physical price. Physical precious metals are a great hedge against such an event.


