
Following futures positions of non-commercials are as of July 16, 2024.
10-year note: Currently net short 637.5k, up 219.6k.
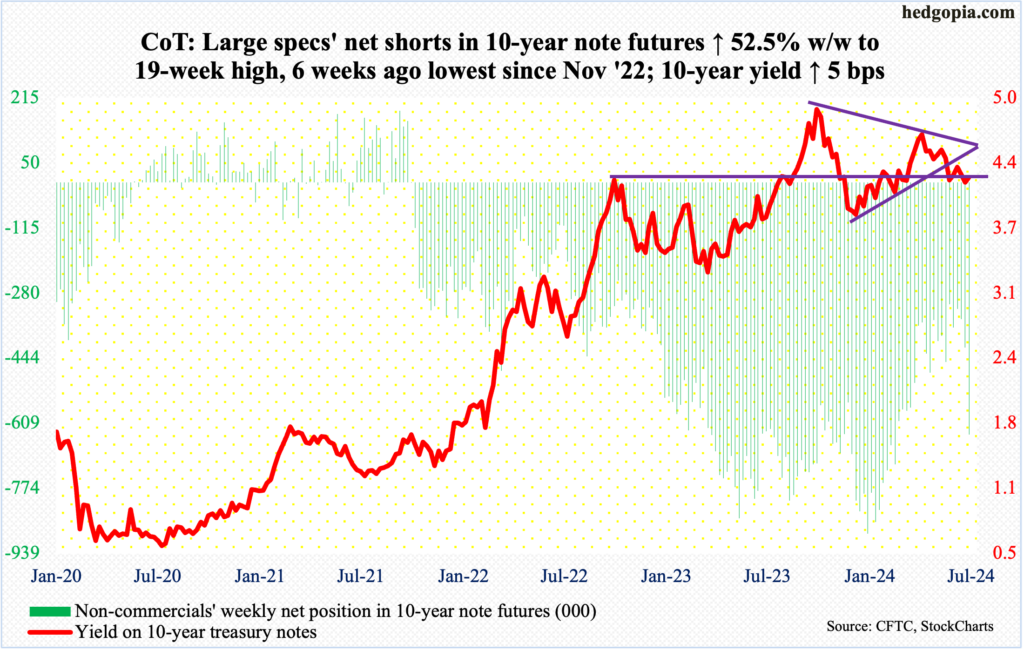
Non-commercials showed aggression in raising net shorts in 10-year-note futures to a 19-week high. In the week to January 16th, they were net short a record 889,385 contracts. This week, their holdings were up 53 percent week-over-week to 637,486 contracts, which have more than doubled in five weeks. These traders may be onto something – in the near term.
The 10-year treasury yield peaked at five percent last October. Rates then bottomed at 3.79 percent in December. This Wednesday, the 10-year reversed higher after touching 4.14 percent, finishing the week at 4.24 percent; bond bears (on price) successfully defended a rising trendline from April last year. They are probably eyeing a falling trendline from last October’s high; this resistance lies at 4.5s. To get there, the 10-year has to first reclaim horizontal resistance at 4.3s.
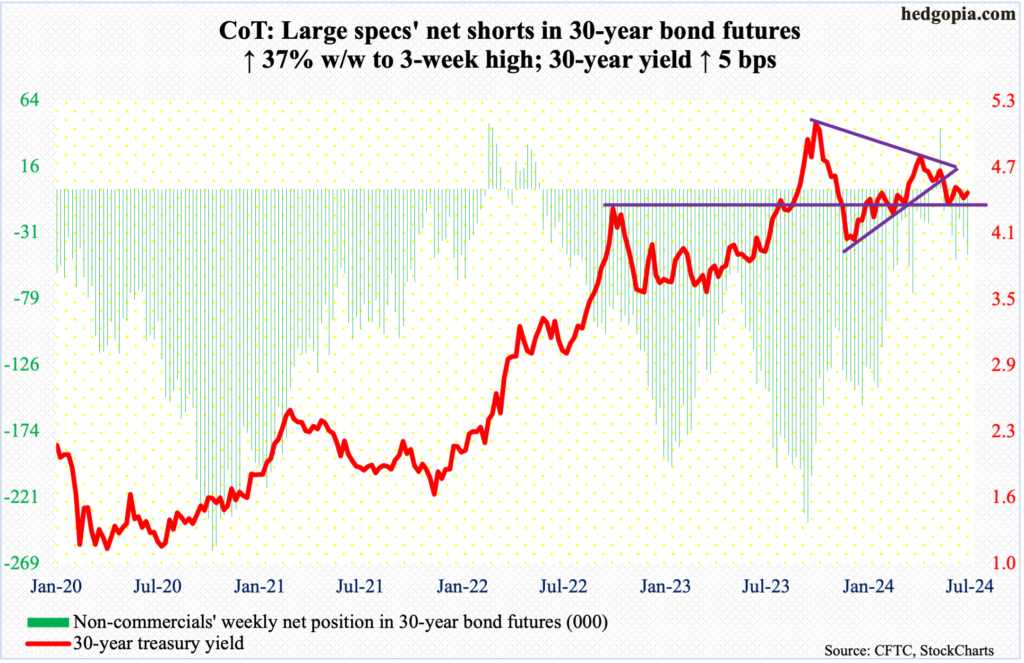
30-year bond: Currently net short 47.2k, up 12.7k.
Major US economic releases for next week are as follows.
Existing home sales (June) are due out Tuesday. May sales were down 0.7 percent month-over-month to a seasonally adjusted annual rate of 4.11 million units. The cycle low 3.85 million was reached last October.
New home sales (June) are scheduled for Wednesday. In May, sales dropped 11.3 percent m/m to 619,000 units (SAAR) – not too far away from last November’s 611,000 units.
Thursday brings GDP (2Q24, advance) and durable goods orders (June).
In the March quarter, real GDP increased at an annual rate of 1.4 percent. Barring negative quarters – -0.6% (2Q22), -2% (1Q22), -28% (2Q20) and -5.3% (1Q20) – this was the slowest pace of growth since 4Q18.
Orders for non-defense capital goods ex-aircraft – proxy for business capex plans – declined 0.6 percent m/m to $73.5 billion (SAAR). Last December, a new record of $74 billion was set.
Personal income (June) and the University of Michigan’s consumer sentiment index (July, final) come out Friday.
In the 12 months to May, headline and core PCE (personal consumption expenditures) each rose 2.6 percent. In 2022, they were galloping ahead at a rate of 7.1 percent (June) and 5.6 percent (February), in that order.
July’s preliminary reading showed consumer sentiment declined 2.2 points m/m to 66 – a six-month low.
WTI crude oil: Currently net long 316.9k, up 16.9k.
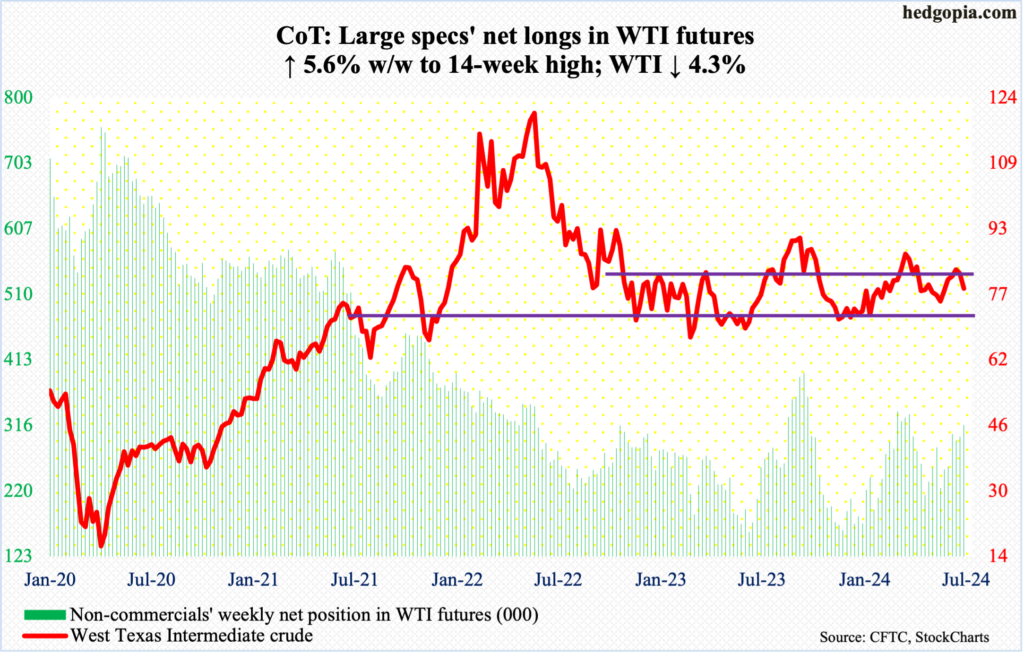
In May last year, West Texas Intermediate crude bottomed at $63.57, earlier having peaked at $130.50 in March 2022. After the May bottom, it then peaked at $95.03 last September – for a lower high. Another lower high was hit this April when the crude retreated after ticking $87.67. A falling trendline from the September high drew sellers two weeks ago at $84.52. This has been followed by back-to-back weekly declines, with this week down 4.3 percent to $78.64/barrel.
Inability to defend $81-$82, which marks the top end of a 10-point range, opens the possibility that WTI eventually heads toward $74, which is where a rising trendline from the May 2023 bottom lies. Early June, the crude bottomed at $72.48 before attracting bids.
In the meantime, US crude production in the week to July 12th was unchanged w/w at a record 13.3 million barrels per day; the level was earlier hit seven times from last December to February. Crude imports rose 277,000 b/d to seven mb/d. As did stocks of gasoline and distillates, which respectively grew 3.3 million barrels and 3.5 million barrels to 233 million barrels and 128.1 million barrels. Crude inventory, however, fell – down 4.9 million barrels to 440.2 million barrels. Refinery utilization decreased 1.7 percentage points to 93.7 percent.
E-mini S&P 500: Currently net short 65.4k, up 10.4k.
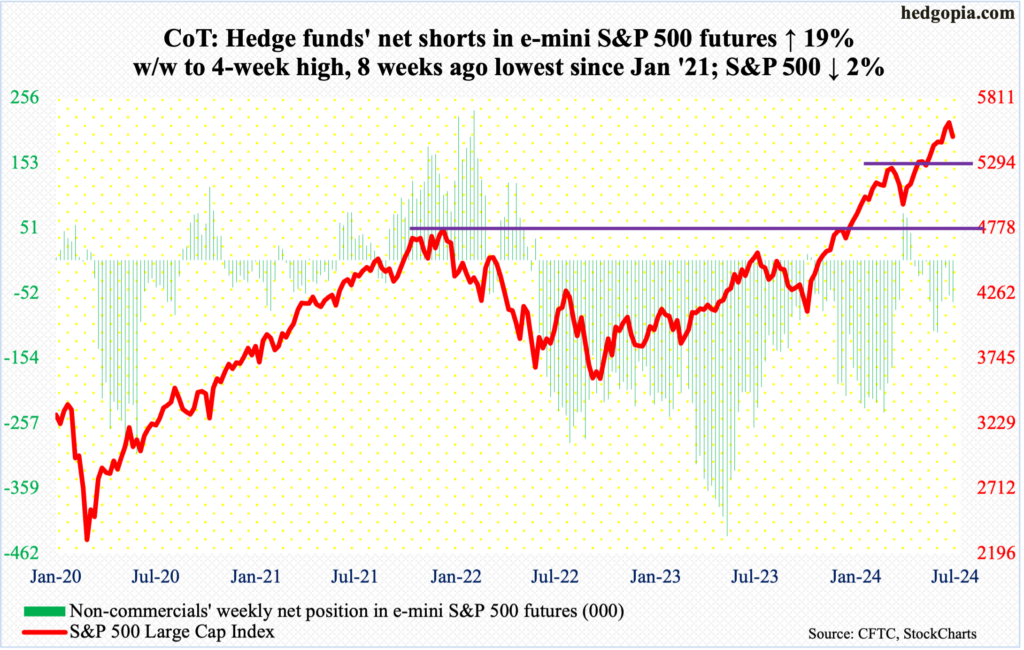
After rallying in 10 out of 12 weeks post-April bottom, the S&P 500 could no longer absorb all the selling pressure that came its way, dropping two percent for the week to 5505. Earlier on Tuesday, the large cap index set a new intraday high of 5670 before tumbling in the next three sessions. Both the 10- and 20-day moving averages have been compromised, even as the daily RSI has dropped to 49.5 from 83 on the 10th this month.
Conditions remained overbought for so long unwinding will take time. The index remains extended on both the weekly and monthly.
Immediately ahead, the 50-day lies at 5410; the S&P 500 has remained above the average since early May. After that, the June 12th gap gets filled at 5370s, followed by lateral support at 5260s. Medium- to long-term, the bulls waited two years before taking out the January 2022 high of 4819; a retest of this breakout is just a matter of time.
Euro: Currently net long 24.7k, up 21.1k.
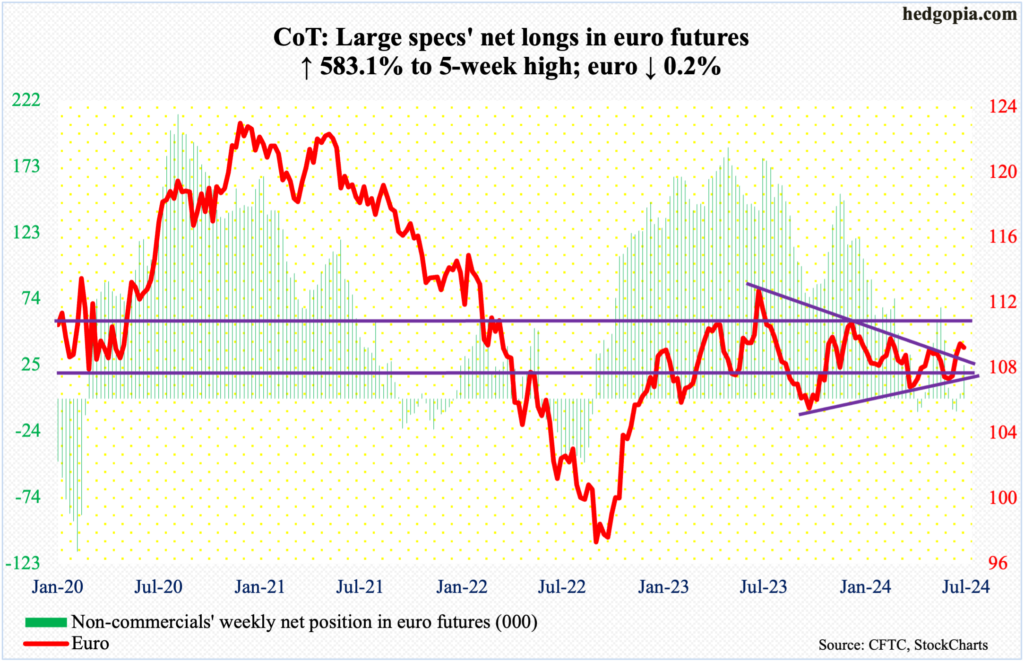
Since last July when the euro retreated after touching $1.128, it has made lower highs. Concurrently, it has made higher lows since last October when it bottomed at $1.045. Using closing prices, the currency broke out of the resulting symmetrical triangle – or a wedge – last week. Using intraday highs, however, the upper line draws to $1.095; this week, it tried to break out but was stopped right on that resistance, with Wednesday rallying to $1.095 and then retreating, closing out the week at $1.088. For the week, it fell 0.2 percent, forming a weekly gravestone doji right on resistance.
For now, the path of least resistance is down.
Gold: Currently net long 285k, up 30.2k.
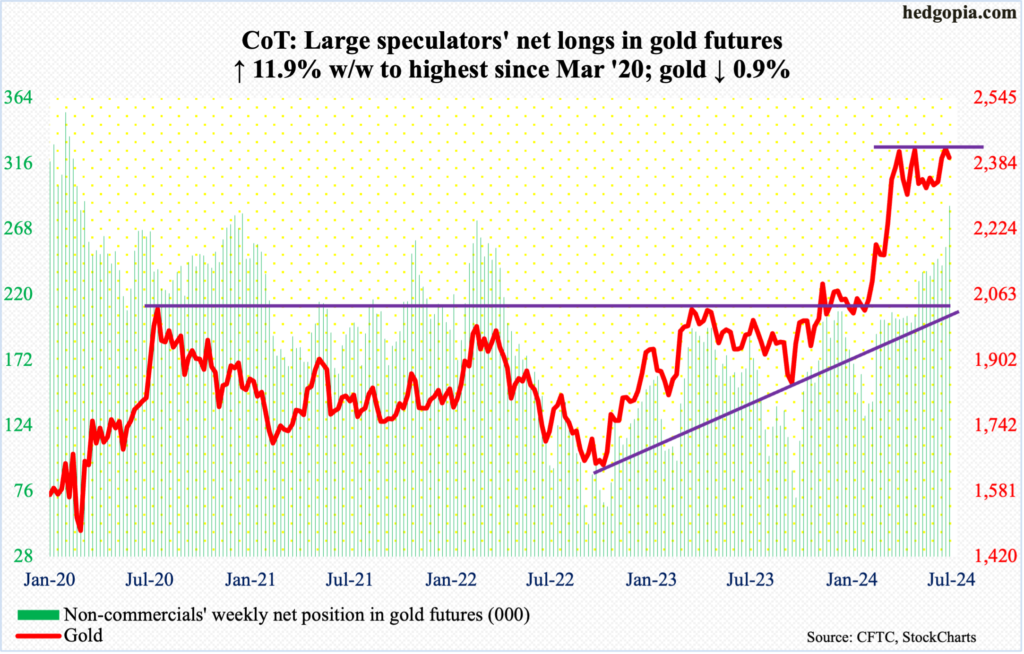
As expected, gold bugs staged a breakout this week but were unable to hang on to it. On Tuesday, gold broke out to a new intraday high of $2,475. The momentum continued Wednesday with another intraday high of $2,488 but only to then reverse lower. By Friday, the metal had given back 0.9 percent for the week to $2,399/ounce.
Prior to the breakout, gold essentially went sideways for three months. On April 12th, it hit a new intraday high of $2,449 before selling off a tad. This was eclipsed on May 20th, as the yellow metal ticked $2,454 before once again coming under pressure. All along, bids showed up at $2,300, a breach of which will have shifted momentum to the bears.
Even now, this week’s action probably does not boost bulls’ confidence. A test of the 50-day at $2,369 probably lies ahead; if this is lost, $2,300 is a must-save for the bulls.
Non-commercials have been aggressively accumulating net longs in gold futures, and it does not take long for them to begin unwinding those.
Nasdaq (mini): Currently net long 5.7k, up 465.
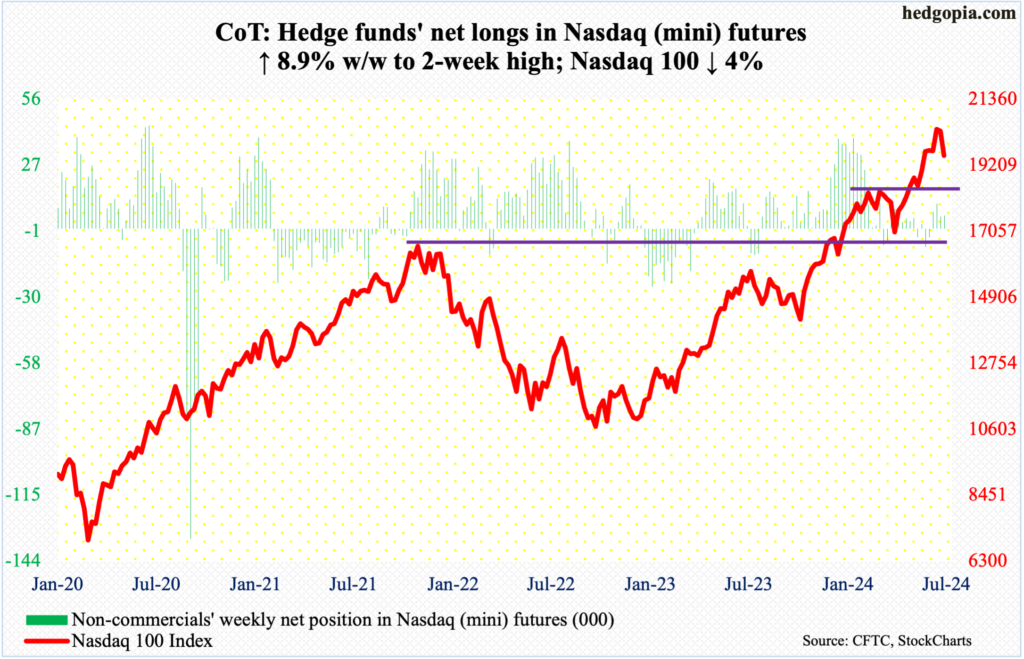
Since last October – and even October of 2022 – tech has led, with the leading few lopsidedly accounting for most gains. This was not going to last forever. The price action of the last few weeks strongly suggests an important top is at hand (more on this here).
This week, the Nasdaq 100 gave back four percent to 19523, losing the 10- and 20-day in Wednesday’s gap-down session. Earlier on the 10th, the tech-heavy index printed a fresh intraday high of 20691 before losing steam.
Ahead of this week’s selling, there were signs of exhaustion. On the weekly, last week formed a spinning top; in the three weeks before that, one more spinning top showed up four weeks ago, and this was preceded by a gravestone doji.
In the sessions ahead, a test of the 50-day at 19322 is not that far away, followed by a June 12th gap fill at 19200s. Then comes horizontal support at 18400s.
Russell 2000 mini-index: Currently net short 47.3k, down 20.3k.
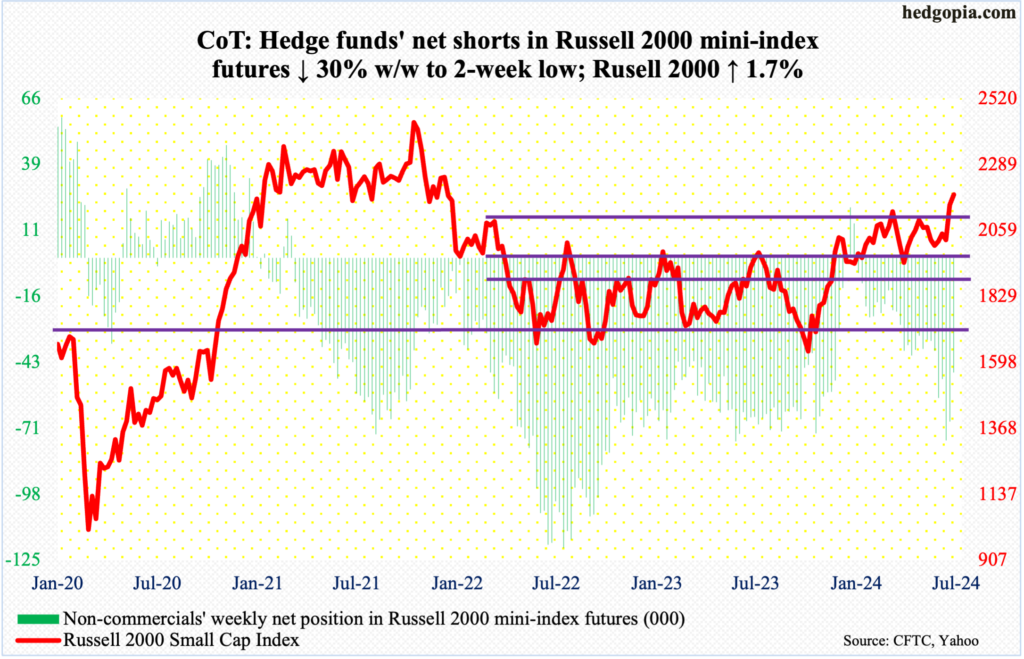
It is a little early to say ‘easy come, easy go’ as relates to small-caps’ performance the last eight sessions, but given that it was primarily FOMO (fear of missing out), aided by a decline in non-commercials’ net shorts, that drove the rally, a reversal was just a matter of time.
Simply put, it was too soon, too fast, with the Russell 2000 surging 250 points over six sessions to Wednesday’s intraday high of 2278. Unable to keep the gains, the small cap index finished the week at 2184.
It so happens that the reversal took place as soon as rallying nearly 200 points after breaking out of 2100 seven sessions ago. Before this, the Russell 2000 was stuck between 1700 and 1900 going back to January 2022 before breaking out last December.
What happens now at 2100 is of utmost importance. The Russell 2000 has had trouble at that level going back to early March. Plus, 2144 represents a 61.8-percent Fibonacci retracement of the drop between the November 2021 peak (2459) and the June 2022 trough (1641); 2100 also represents a measured-move price target post-breakout at 1900.
If it is a genuine breakout, a retest should be widely embraced by the bulls – both old and new (more on this here).
US Dollar Index: Currently net long 18.6k, up 2.3k.
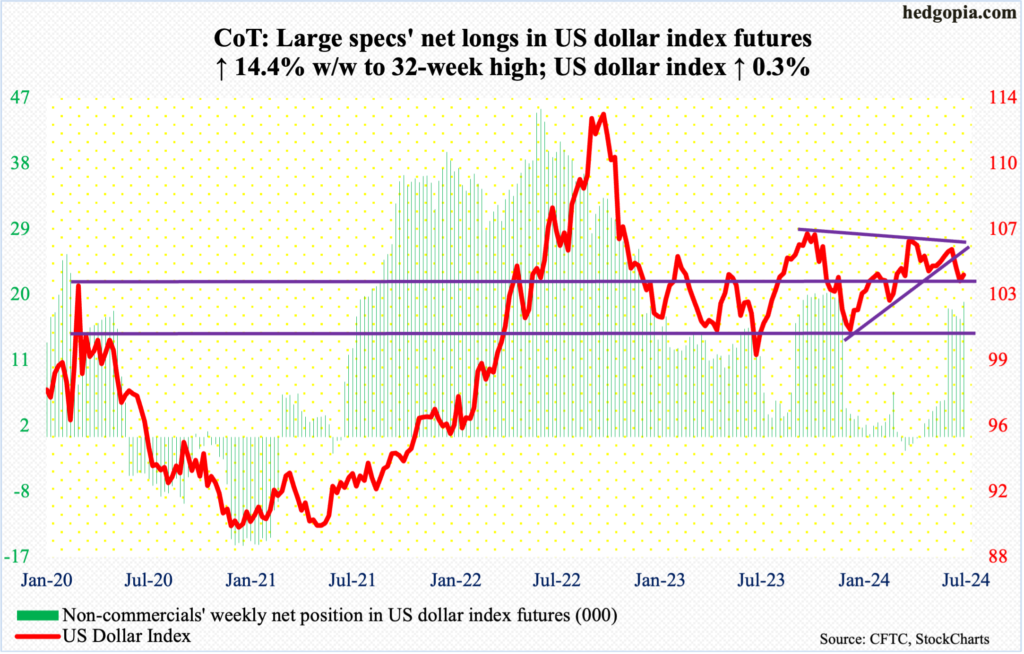
Two weeks ago, the US dollar index fell out of a symmetrical triangle, made up of a falling trendline from last October when the index peaked at 107.05 and a rising trendline from last December when the index bottomed at 100.32. After a 0.7-percent decline last week, dollar bulls are saying ‘enough is enough’, and rallied the index 0.3 percent this week, forming a weekly bullish hammer. Having dropped as low as 103.34 on Wednesday, the index ended the week at 104.11.
Horizontal support at 103-104 goes back to December 2016. This was a must-save for the bulls, and it seems to be holding. The daily has room to head higher.
VIX: Currently net short 62.3k, up 827.
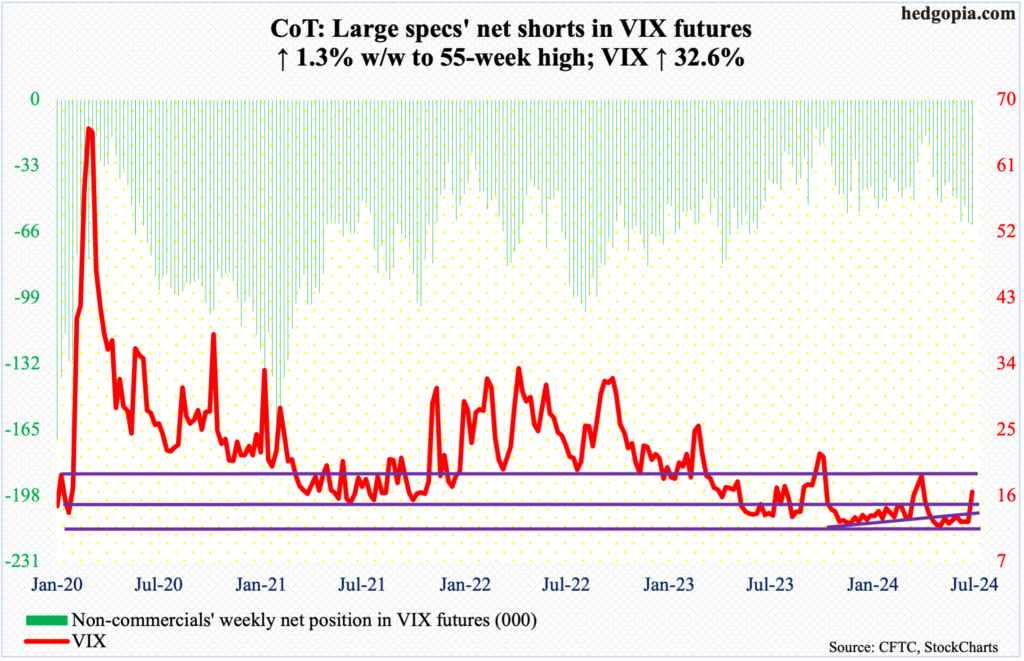
In Friday’s yo-yo session, VIX tagged 10.62 intraday – the lowest since August 2018 – but only to reverse higher to end the session at 16.52. For the week, the volatility index added 4.06 points. Before this week’s strong print, VIX went sideways just under 12.50 for three weeks – last week’s 12.46 was preceded by 12.48 and 12.44.
The daily is beginning to get overbought. Several times in the past, VIX has tended to reverse after an unsustainable spike. Thus far, there has been no spike reversal.
Thanks for reading!
More By This Author:
Amidst Frothy Sentiment, Tech Leads Equities Lower
Small-Caps Come Roaring Back – Imminent 2100 Retest Will Be Telling
What The CoT Is Saying About The Future Through Futures, How Hedge Funds Are Positioned


Comments
Log in or sign up to join the conversation.