
Junk Bonds Suggesting Stocks Have Much More Downside?
When stocks are showing weakness, we can learn a lot by watching the credit markets.
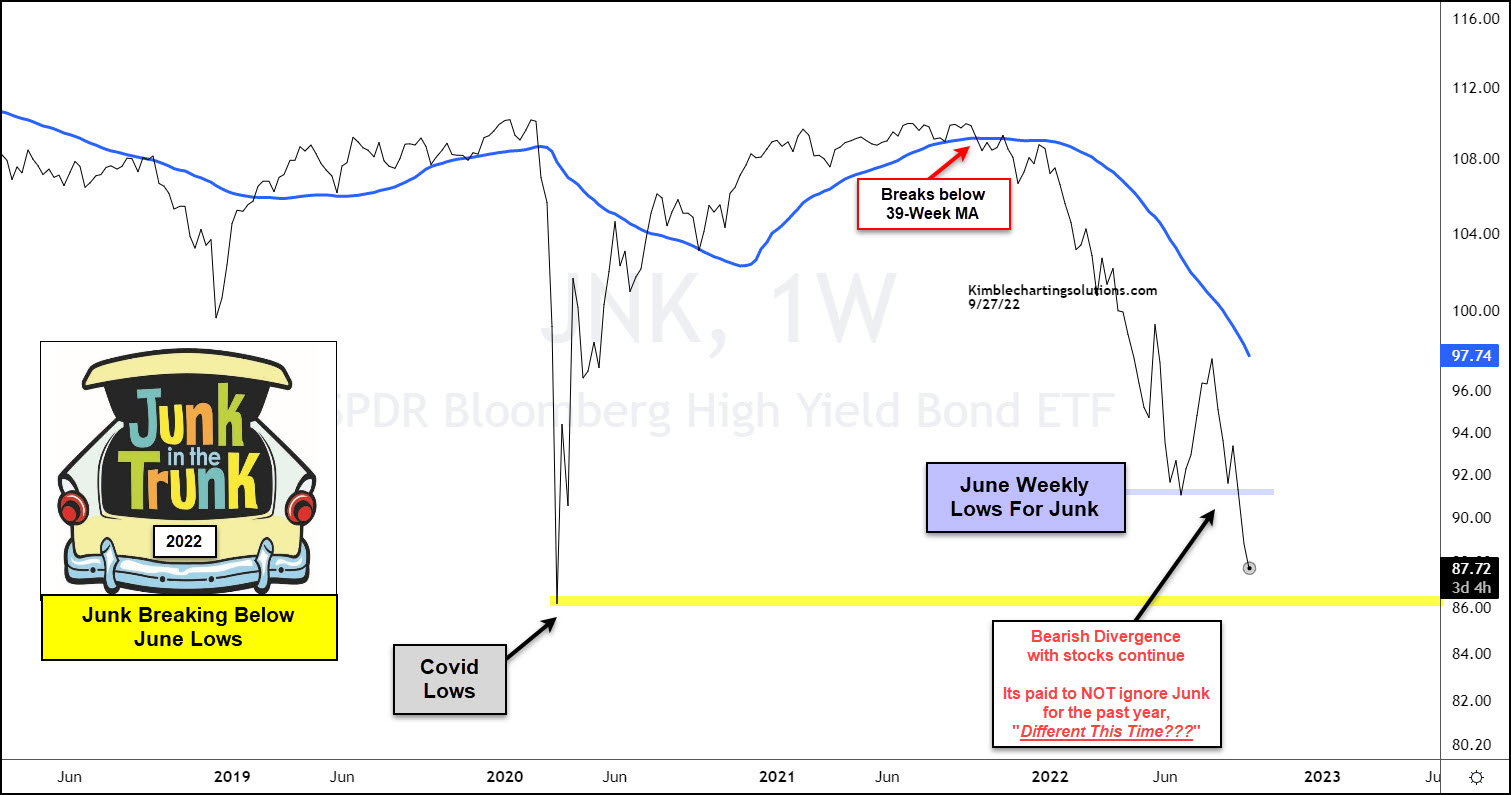
And in today’s case, Junk Bonds and the ETF JNK.
Better yet, today we share 2 charts to better illustrate was is happening in the broader markets.
The first chart is the Junk Bonds ETF (JNK) on a “weekly” timeframe. As you can see, JNK is nearing its COVID lows and has fallen much lower than its June low. This has formed a bearish divergence with stocks, as several indices have yet to puncture the June low… or, if they did, it was very marginal.
(Click on image to enlarge)
The second chart looks at JNK versus the S&P 500 ETF SPY. This illustrates just how much further JNK has fallen when compared to stocks.
(Click on image to enlarge)
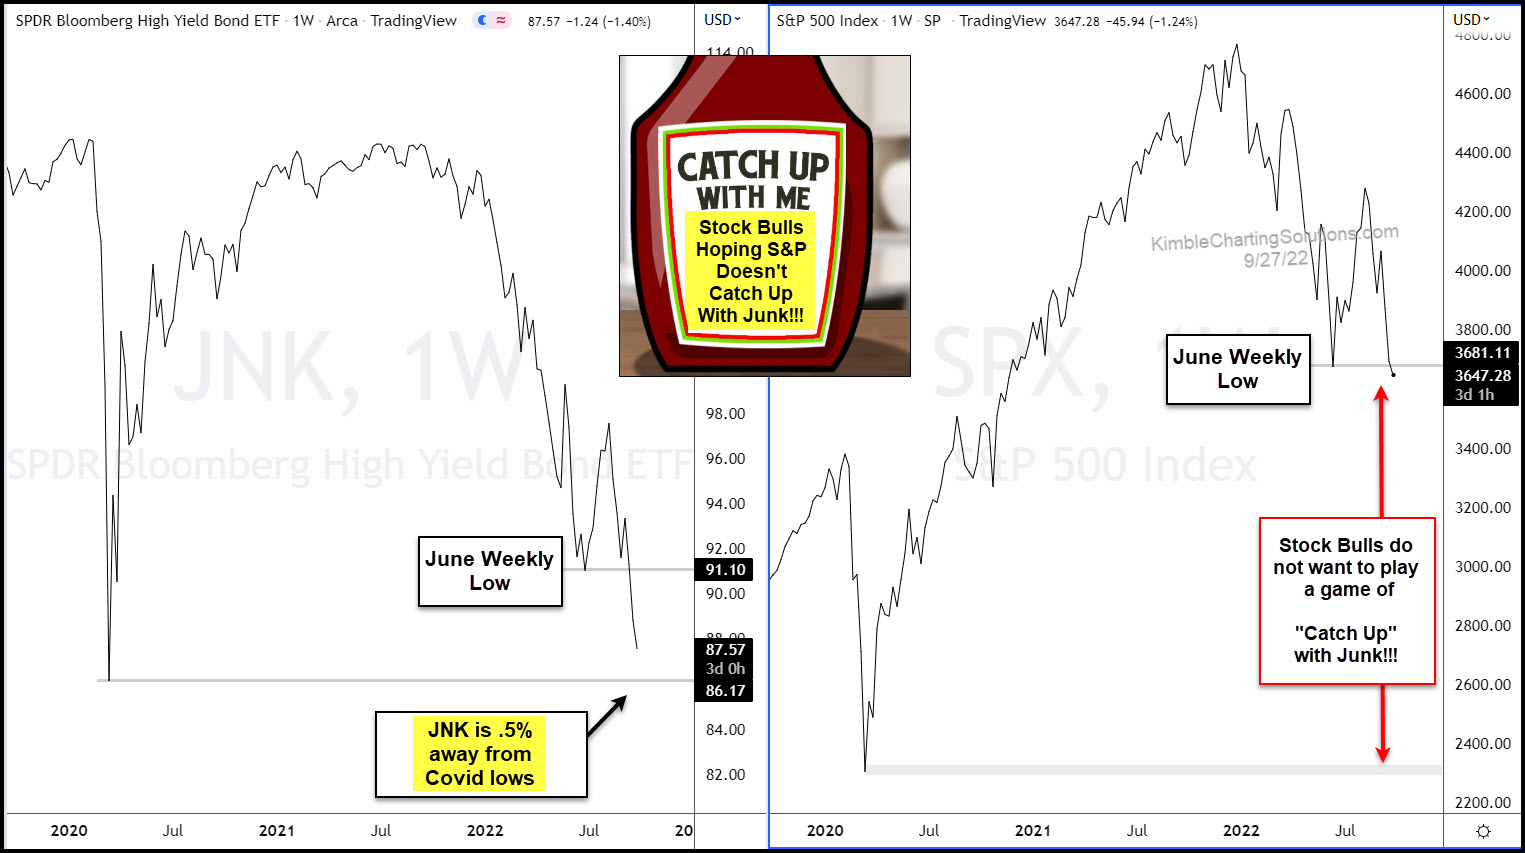
In summary, stock bulls do not want to play a game of catch up with junk bonds!
More By This Author:
Tech Stocks Leadership Reaches Important Trend Line Support
NYSE Composite Breakdown, Taking Out June Lows, Another Warning To Bulls
Fed Funds Could Rise 2% More, Says 2-Year Yields And Joe Friday
Disclosure: Sign up for Chris's Kimble Charting Solutions' email alerts--click here.


