
We are living through another chapter in the decade-old currency wars—and Japan is winning.
After a bold move from ¥103 to ¥138 per dollar in less than two years, suddenly the Japanese yen is at a weak level not seen since 1998.
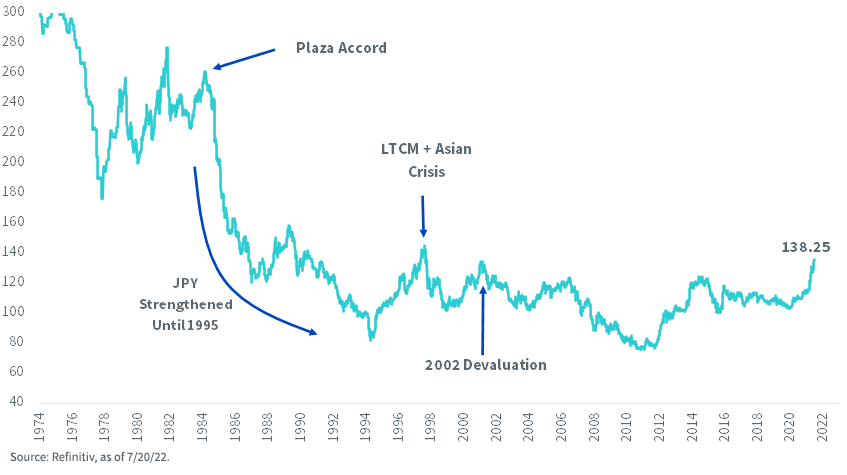
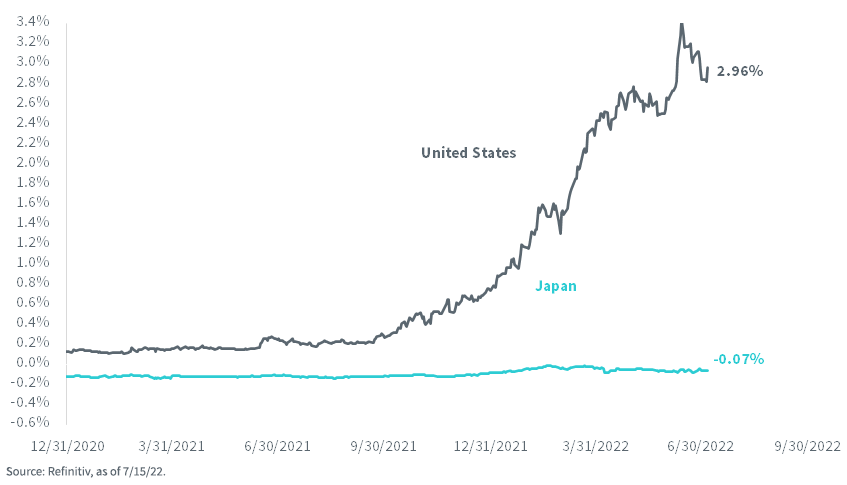
The yen’s collapse is even more remarkable when you consider that Japan’s consumer price inflation was 2.5% over the last year—a far cry from the 9.1% rate in the U.S. (figure 1).
Figure 1: Japanese Yen per U.S. Dollar
Dollar-yen isn’t the only pair that matters. There is also a moment of truth happening right now between the yen and the Chinese yuan.
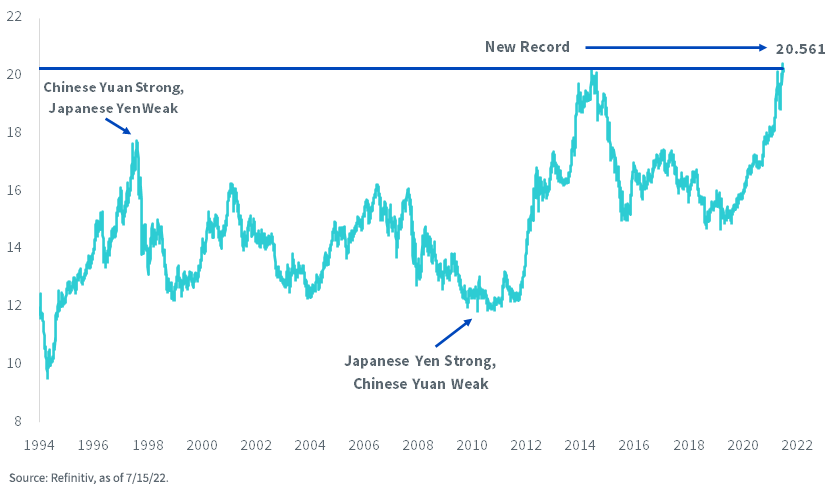
Each country is the other’s largest regional trade rival, so it’s notable that the yen is attempting to break through ¥20.56 per Chinese yuan, which would mark an uncharted weakness for Japan’s currency (figure 2).
It has created a situation in which Japanese corporations are becoming increasingly price competitive against companies based in China.
Figure 2: Japanese Yen to Chinese Yuan Exchange Rate
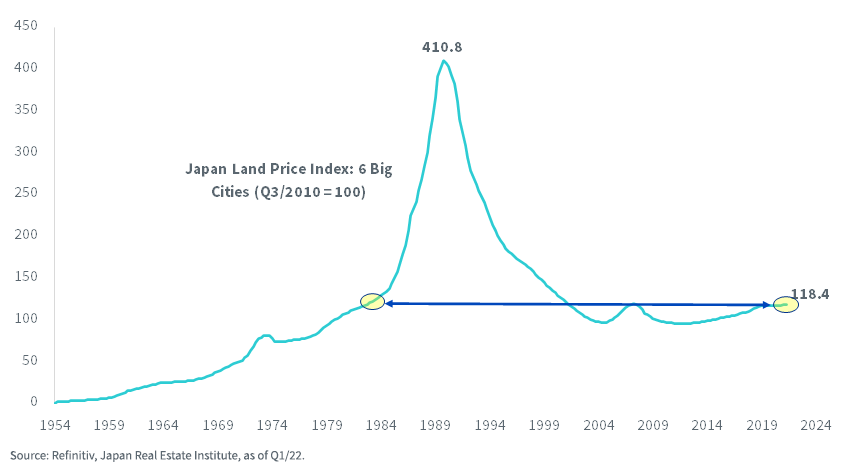
Unlike the U.S., which may have to spend the next few years contending with a housing market that appears to be rolling over, Japan’s speculative juices found their ugly end over three decades ago (figure 3).
Figure 3: Japan’s Land Prices Are at 1983 Levels
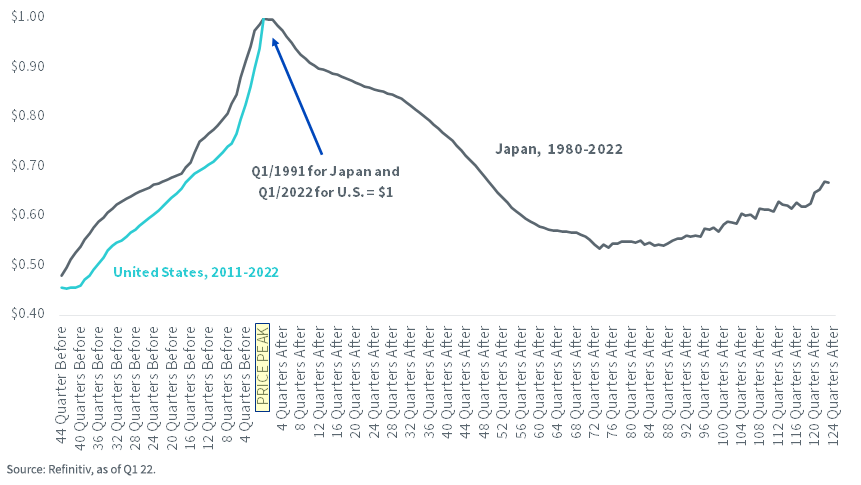
Interestingly, U.S. residential property prices appreciated more in the last 11 years than Japan’s did in the final 11 years of its bull market, which were from 1980–1991 (figure 4).
Figure 4: U.S. Residential Property Price Appreciation, 2011–2022, Overlayed on Japan
But because asset prices in the U.S. have melted up, now we have a relative value set-up that favors Japan from a “TINA” framework.
The acronym means “There Is No Alternative” available to investors beyond just biting their tongue and buying up stocks because you couldn’t—past tense—find any yield in U.S. bonds. Though the TINA arithmetic has faded in the U.S. because of rising rates, Japan’s bond yields refused to follow along, owing to the country’s central bank bond purchases (figure 5).
Figure 5: 2-Year Government Bond Yield
Try this exercise: make a list of all S&P 500 stocks that have an earnings yield that is at least 10 percentage points higher than the yield on two-year Treasuries.
There are 38 such companies.
In Japan, if you run the same exercise on the TOPIX 500, the screen comes up with 133 stocks that have earnings yields that are 10 points higher than two-year JGBs (figure 6).
Figure 6: Number of Index Members with Earnings Yields More than 10% Higher than Domestic 2-Year Government Bonds
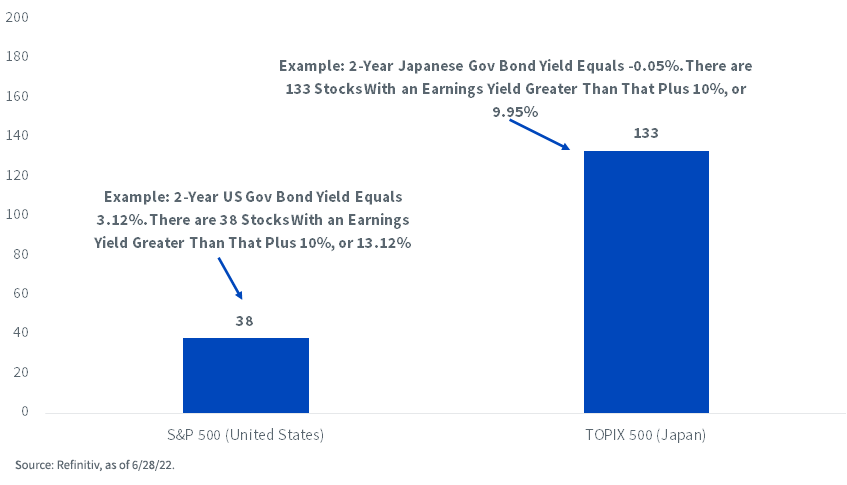
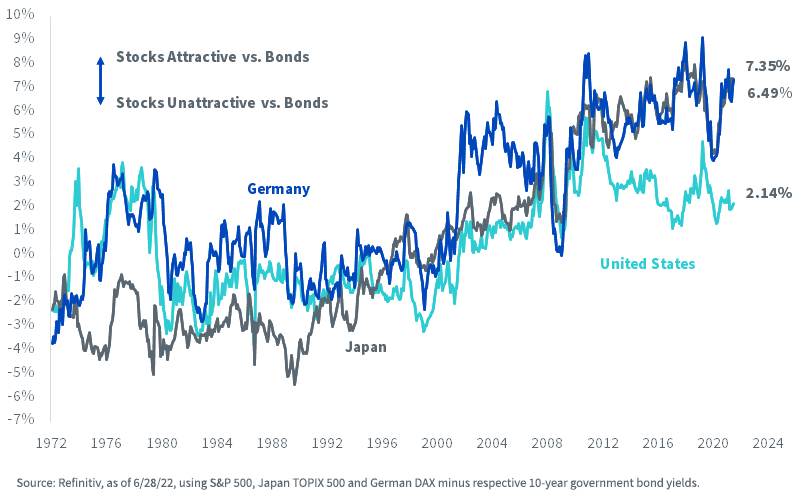
Figure 7 shows another stock-to-bond comparison: the broad market earnings yield gap over 10-year sovereigns. Japan’s TOPIX 500 offers a spread of 737 basis points (bps) over near-zero yielding JGBs, considerably more than the 161 bps spread offered by the S&P 500.
Figure 7: Stock Market Earnings Yield Minus 10-Year Government Bond Yield
More By This Author:
Dividends For Defensive Value
There's Income Back In Fixed Income
Looking for Recession Clues in All the Wrong Places?


Comments
Log in or sign up to join the conversation.