

Image Source: Pixabay
As we shared in a recent Daily Commentary about interest rates:
The current unemployment rate is 4%, and the core PCE inflation rate is 2.6%. In December 2019, the unemployment rate was 3.6%, and the core PCE was 1.6%. At the time, Fed Funds were 1.5%. Here we sit today, with the unemployment rate .4% higher and core PCE 1% higher than in 2019. Yet, the Fed Funds rate is 4% more than in 2019. Does it seem a bit high?
Nine months ago, we discussed some factors keeping yields above what we believe is their fair value. To wit, we ended Bond Market Noise, with the following statement:
The noise in the bond market is thunderous these days as inflation is still well above norms, deficits remain high, and the Fed continues to promise higher rates for longer. Noise creates differences between the yield on bonds and their true fair value.
Noise is hard to ignore, but it can create tremendous opportunities!
Neither the Commentary nor the article discussed R Star as a culprit behind higher yields. Therefore, given some recent mentions of R Star by Fed members, it’s worth adding to our prior analysis by diving into this wonky economics topic.
Before discussing R Star, we will update you on inflation and deficits, the two factors keeping yields high, as discussed in Bond Market Noise.
Inflation
In our opinion, the primary reason that yields are too high is a pronounced fear from the Fed and bond investors of another round of inflation. The Fed runs an extraordinarily tight monetary policy to ensure it doesn’t reoccur. Investors are demanding a premium on yields to help protect against said fear.
In Bond Market Noise, we shared the best predictor of long-term yields, the Cleveland Fed Inflation Expectations Index. As shown below, the index, using current, surveyed, and market implied inflation is extremely correlated with ten-year Treasury yields.
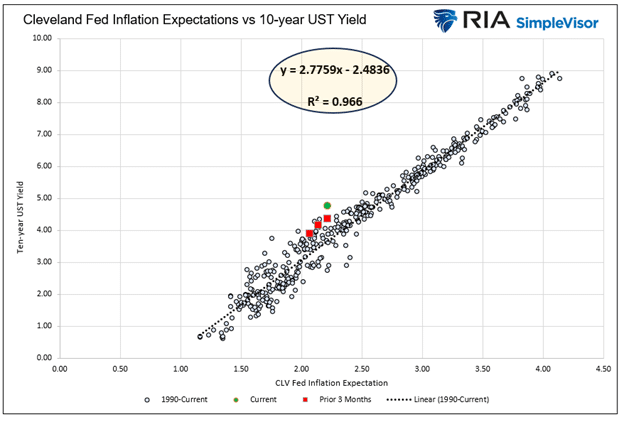
Since we published the graph, the Cleveland Fed index has fallen by 0.01%, while the yield on the ten-year Treasury is down by .35%. The extreme yield differential that existed when we wrote the article has normalized somewhat. However, the model’s fair value ten-year yield is about .40% below current yields.
If the disinflation trend resumes, as seems increasingly likely, the Cleveland Fed index will likely decline. Every basis point decline in the index results in a 2.75 basis point decline in the model Treasury yield. Therefore, a substantial yield decrease is plausible if the index returns to the pre-pandemic average. Furthermore, a recession could push the index and model yields much lower.
Such may sound absurd given where yields are and what we have experienced over the last few years, but the ten-year yield was 0.50% not so long ago.
Deficits
Federal deficits are running larger than average, causing a bearish skew of Treasury debt supply versus investor demand. The imbalance is partially due to an extra $500 billion yearly in interest expenses, almost entirely due to higher interest rates. Of course, significant deficit spending is also responsible.
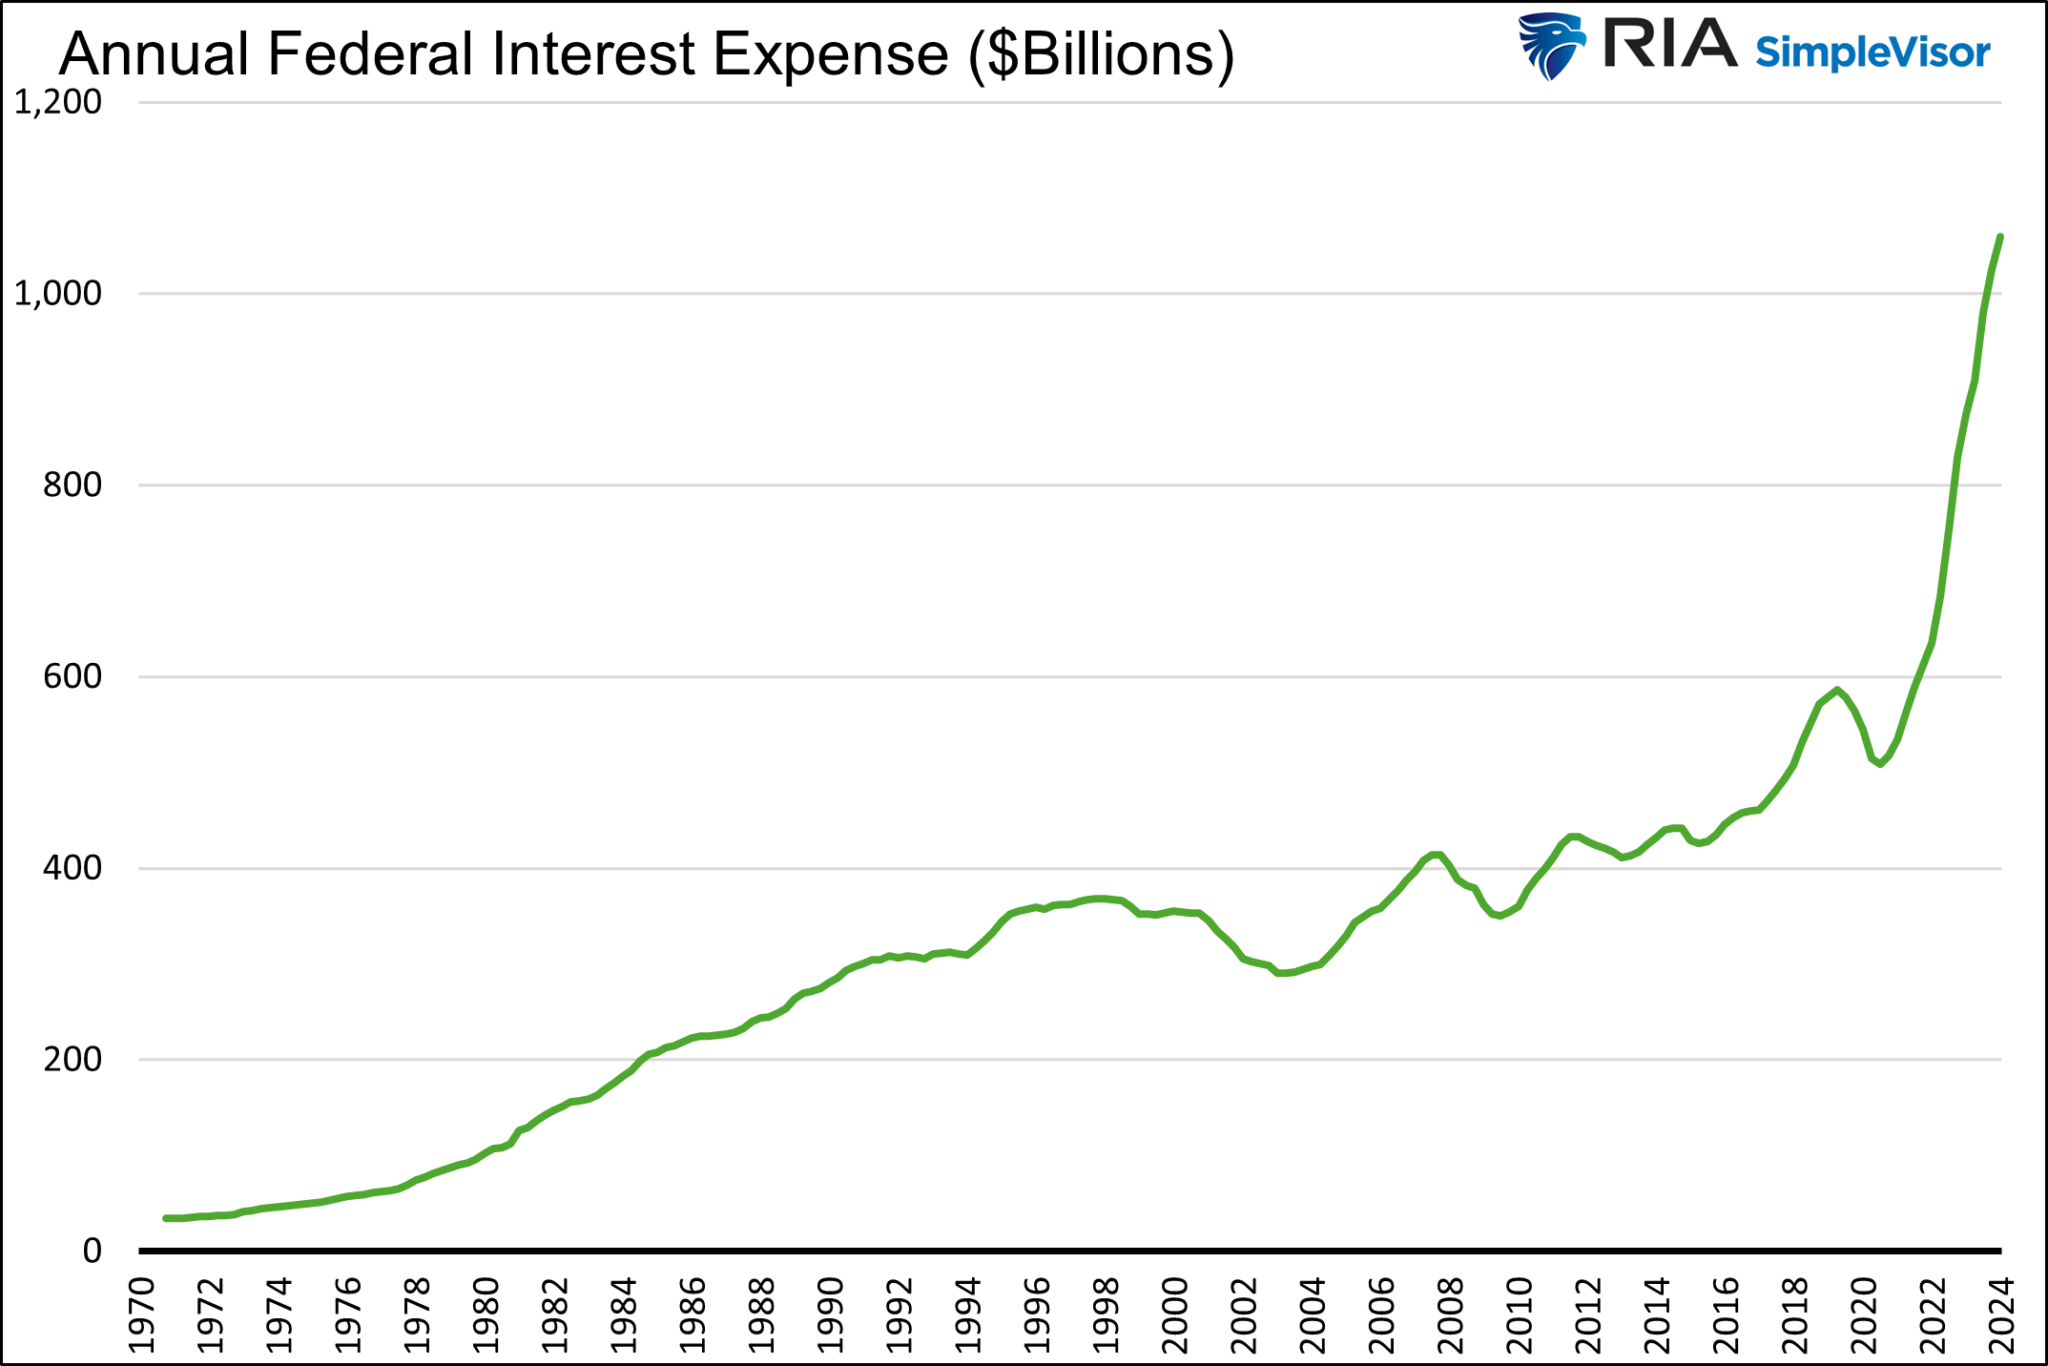
Assuming no significant changes to the rate of government spending, deficits will fluctuate with interest rates. Therefore, in a circular fashion, when interest rates fall, the market’s fear of fiscal deficits will likely lessen.
The graph below puts the deficit and interest expenses into context. It shows deficits, sans interest expenses, as a percentage of GDP. The recent peak, 5.71%, is historically high, but notice the deficit spending of the financial crisis and pandemic-related stimulus dwarf it. Further, last quarter’s peak is not far from the 2016 and 2018 highs when spending was not generally considered out of control.
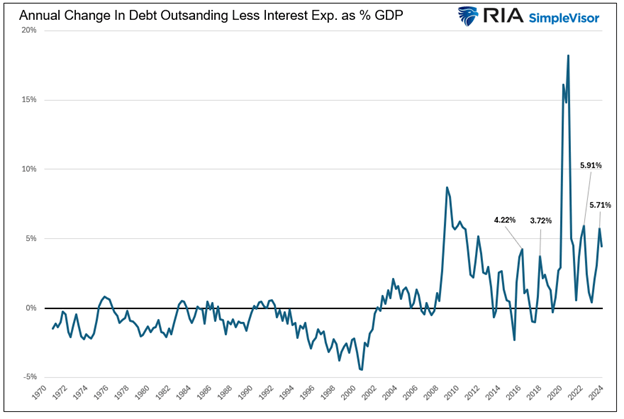
We are not trying to minimize the deficits in how we present the data. However, proper consideration is warranted since interest rates substantially impact deficits and debt issuance.
The Mythical R Star
Now, let’s dig into the economic textbooks and share a third reason: yields are higher than expected.
R Star is the real neutral rate of interest that balances the economy. It guides the Fed on how much of a headwind or tailwind their interest rate policy impacts the economy. The problem is that R Star is mythical. There is no definitive R Star. Hence, managing interest rates for the Fed is based on a guessing game of R Star.
Some economists and bond investors believe the R Star has increased over the past four years due to the pandemic. Thus, bond yields should be higher if R Star or the natural economic growth rate has increased.
The first graph below, courtesy of the New York Fed, shows two similar R Star models the Fed relies upon. The second graph charts them together with their trend lines.
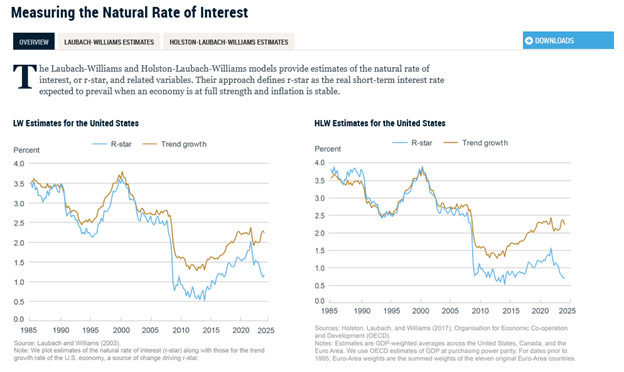
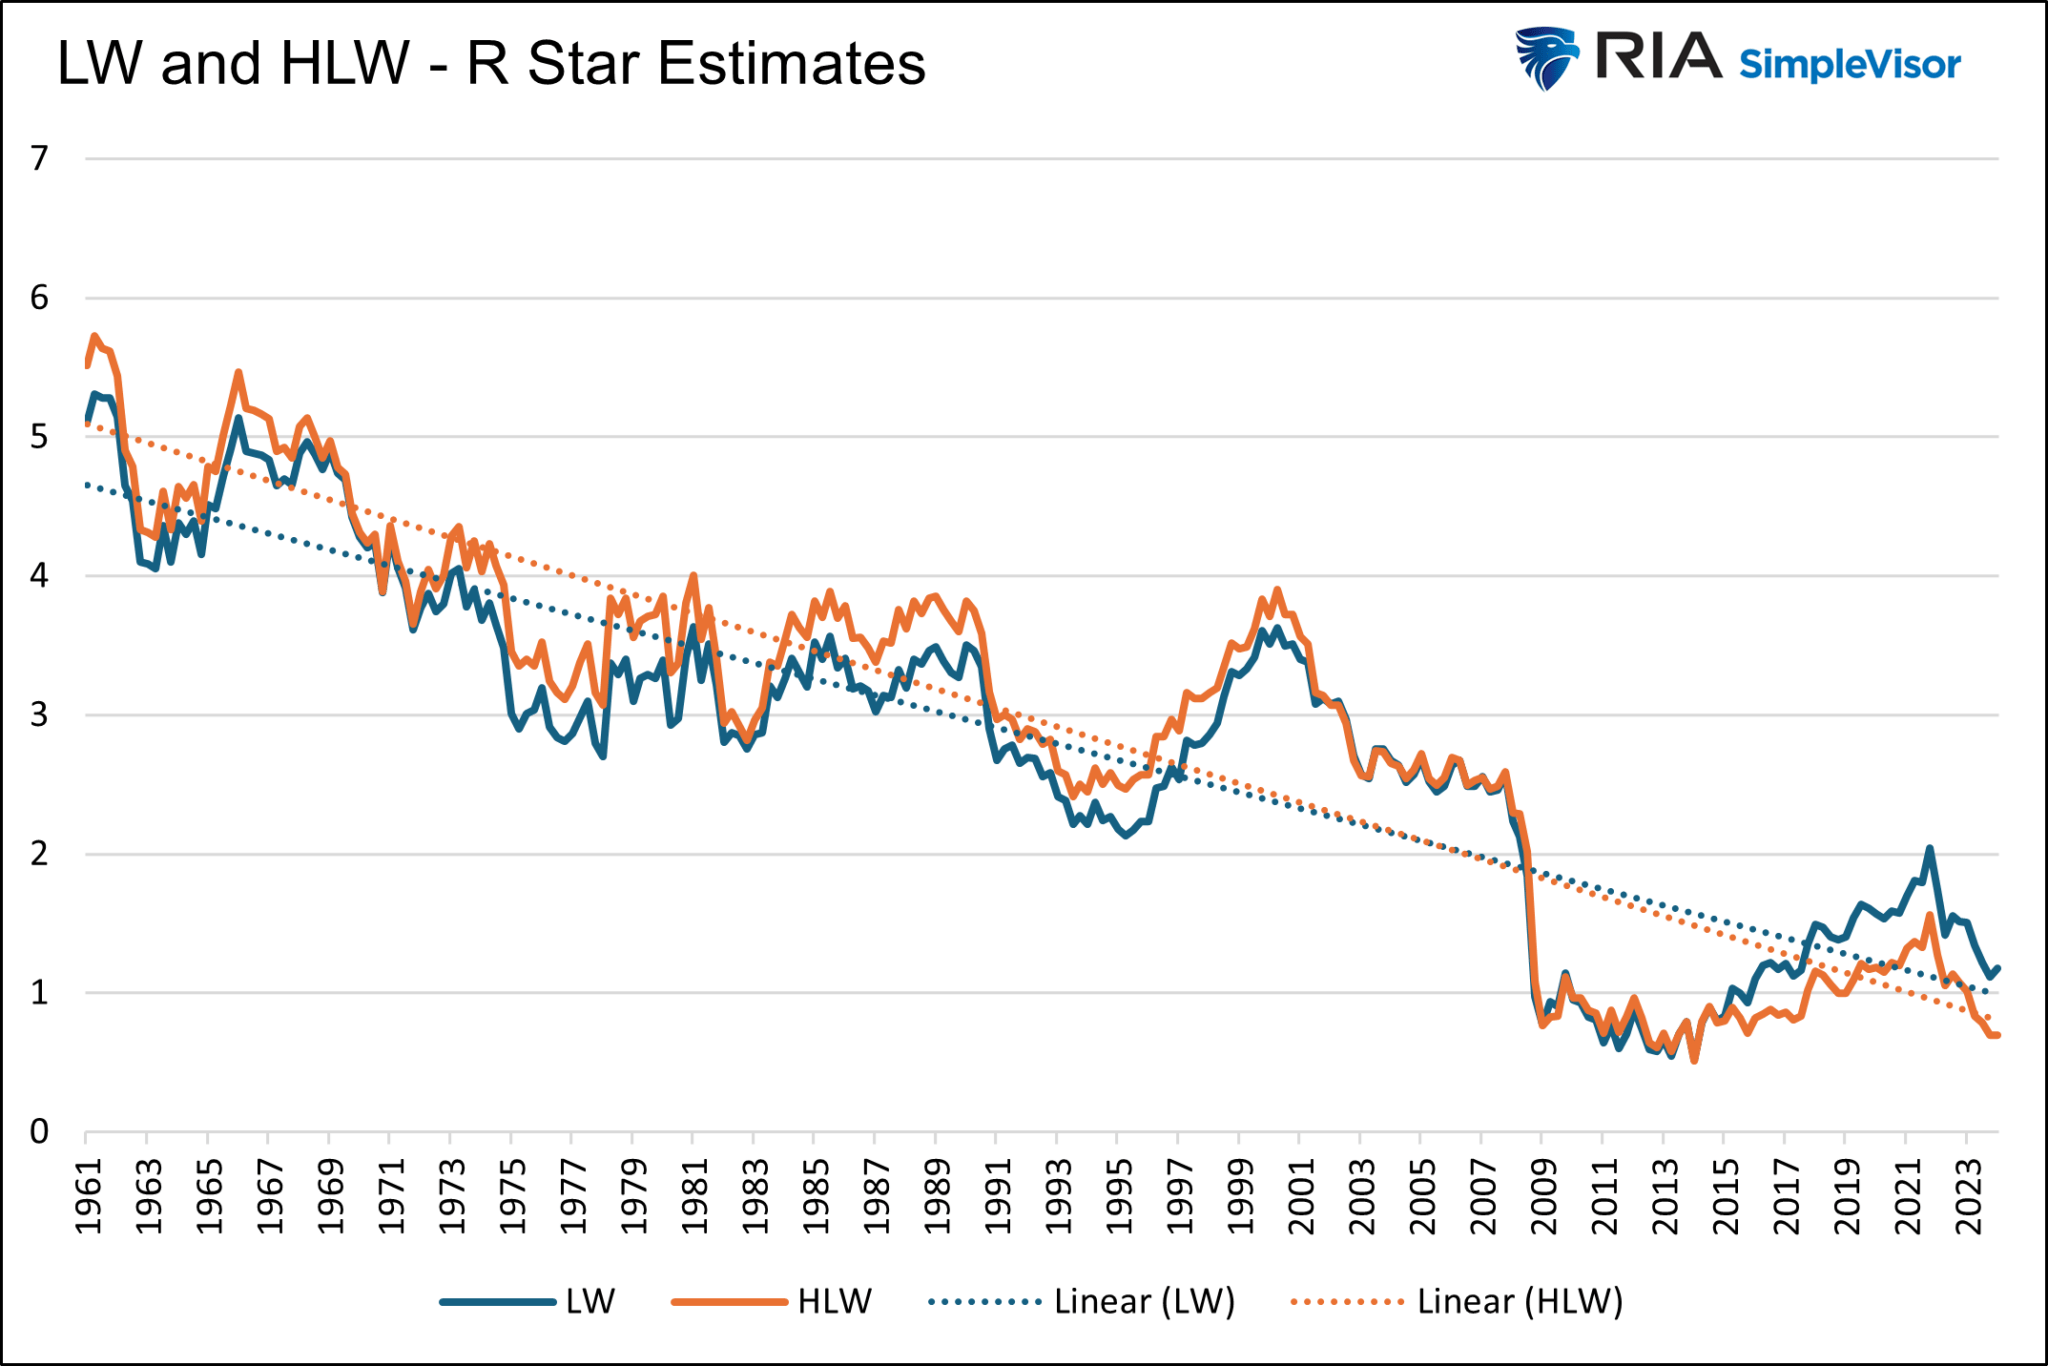
As you can see, the two model rates fluctuate, but both have a decidedly lower trend. The Laubach-Williams model (blue) shows that the R Star is 1.18%, while the Holston-Laubach-Williams model (orange) is 0.70%. Assuming the Fed’s 2% target rate is the “stable inflation rate,” the models would argue an appropriate Fed Funds rate is between 2.70% and 3.18%. Currently, the rate is 5.25-5.50%.
Also noteworthy is that the trend lines imply that the R Star will decline by roughly .06% yearly.
Those bearish bond investors who think R Star will trend higher must believe the economic growth rate will reverse its trend of the last 40+ years.
Fed President Williams on R Star
We appreciate the argument that AI can be significant but are not sure we buy into how it affects economic productivity. Furthermore, demographics and massive outstanding unproductive debt will likely detract from economic growth in the future.
In a recent speech, New York Fed President John Williams stated his case against a new upward trend in R Star.
“Although the value of R Star is always highly uncertain, the case for a sizable increase in R Star has yet to meet two important tests.“
The first is the “interconnectedness” or the R Star in other developed countries. There is no evidence that R Star is rising in Europe, China, or Japan.
“Second, any increase in R Star must overcome the forces that have been pushing R Star down for decades.“
Have productivity and demographics suddenly changed for the better? Again, there is no evidence that this is happening.
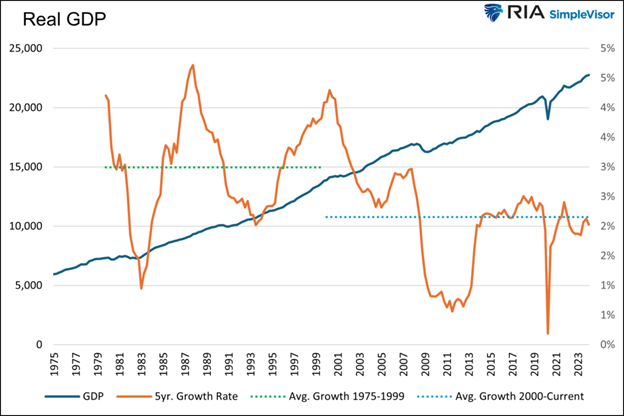
Lastly, we share a graph from Irrational Exuberance Then and Now.
Despite the internet and technology boom of the late 1990s and beyond, the economic and corporate earnings growth rate did not increase. In fact, as shown below, the economy grew at an average rate of nearly 3% from 1975 to 1999. Since then, the average growth rate has been closer to 2%.
Summary
Suppose you think rates have reversed their downtrend of the last forty years and will reside at current levels or even higher. In that case, you must believe something significant has materially changed with the economy. The pandemic and the associated stimulus provided a roller coaster of economic activity, creating an economic mirage, but have the primary factors driving growth changed?
We say no and thus believe that interest rates still have plenty to decline alongside the mythological R Star.
More By This Author:
Irrational Exuberance Then And Now
Fiscal Dominance Is Here
Petrodollar Panic: Separating Fact From Fiction

Comments
Log in or sign up to join the conversation.