
If Campbell Harvey’s Specification Is Right, We’re (Still) In Trouble
Robust GDP growth, employment rising on pace, perceived recession risk declining… as in this headline. The latest issue of the Economist has an article entitled Fears of recession have faded. But I’m reminded that Campbell Harvey, who wrote early papers on the subject of yield curve predictors, relies on the 5yr-3mo spread (for growth, not recession). And that implied specification signals 44% probability of recession in 2020M04.
From Bloomberg:
“My economic model is not just predicting economic recessions, it’s predicting economic growth,” Harvey said. “If you’re flat or you’re inverted it’s saying the same thing: growth will slow.”
A snapshot of the yield curve Friday, a week earlier, a month earlier, and a year earlier:
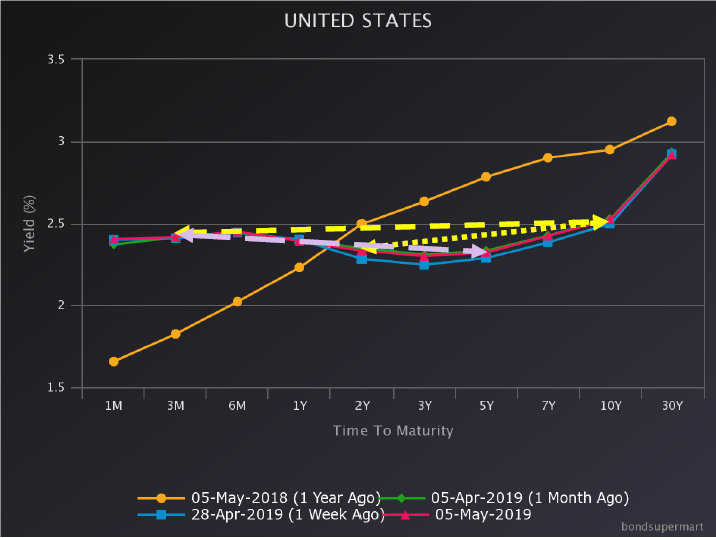
Figure 1: Slope of 10yr-3mo curve (yellow dashed arrow), of 10yr-2yr curve (yellow dotted arrow), of 5yr-3mo curve (violet arrow).
The 5yr-3mo spread, unlike other commonly used spreads, is inverted. The time series is quite informative.
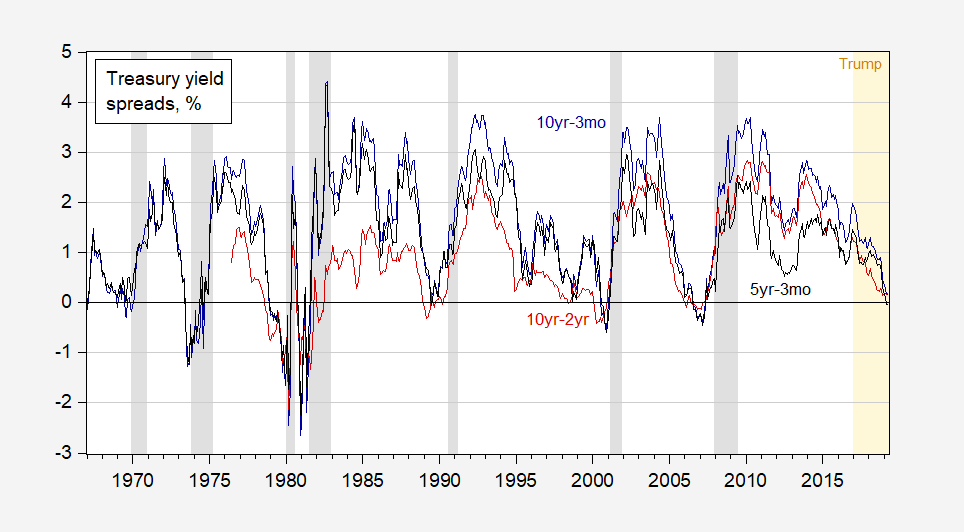
Figure 1: Treasury 10 year minus 3 month spread (dark blue), 10 year minus 2 year (dark red), and 5 year minus 3 month (black). NBER defined recession dates shaded gray. Trump administration shaded orange. Source: Fed via FRED, NBER and author’s calculations.
The 5 year – 3 month spread is negative, just as it has been before each of the previous recessions. A detail is shown in Figure 2.
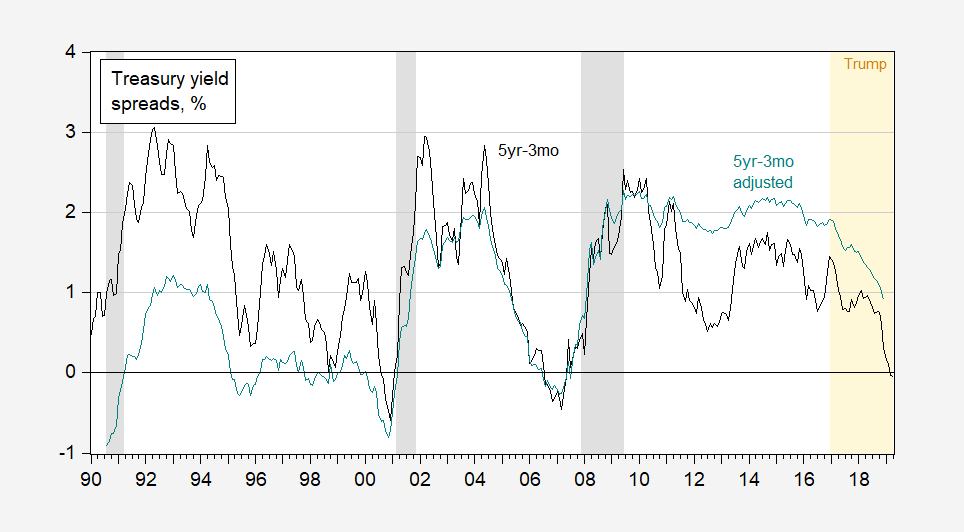
Figure 2: Treasury 5 year minus 3 month (black), and adjusted using Kim-Wright term premium on 5 year bonds. NBER defined recession dates shaded gray. Trump administration shaded orange. Source: Fed via FRED, NBER and author’s calculations.
Running a probit regression 1967M01-2019M04 yields:
Pr(recession=1) = –0.023 – 0.90x(gs5-tb3ms)
McFadden R2 = 0.31, N = 616. Bold figures denote significance at 5% msl.
The implied regression probabilities for indicated months are shown in Figure 3 (i.e., the 2020M04 value is that predicted using 2019M04 spread):
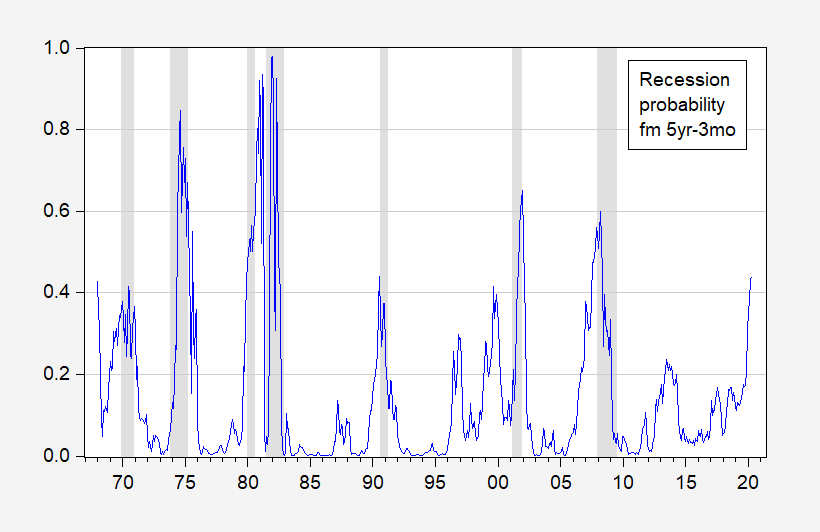
Figure 3: Implied probability of recession using Harvey 5 year – 3 month spread lagged one year (blue).NBER defined recession dates shaded gray. Source: Author’s calculations.
While the probability as of 2019M04 is high, it’s not as high as at the outset of the 2007M12 recession (but is higher than that at the outset of the 2001M03 recession).
Some observers have argued that the distortions in long term bond market, due to large scale asset purchases, have rendered misleading the yield curve (see the discussion here). In order to address this, I adjust the spread by the term premium estimated for 5 year zero coupon bonds using the Kim-Wright method. This is shown as the teal line in Figure 2; in contrast to the 2006 period, the adjusted spread as of 2018M12 is higher than the unadjusted.
If indeed the pure expectations hypothesis of the term structure component is the predictive part, then the estimated probability of recession would be lower (quick estimate, 6% using data 1990-2019).
Paper on yield curve/growth here: Campbell Harvey (FAJ, 1989).
Disclosure: None.


