
Home Prices Vs. Stocks Long Term

Image Source: Unsplash
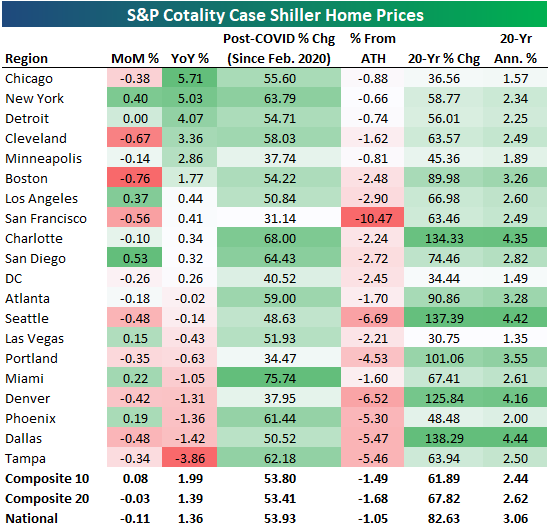
The latest Case Shiller home price data from S&P Cotality was published today and showed a small month-over-month decline of 0.11% at the national level. Home prices were up just 1.36% year-over-year nationally as well.
Across the twenty cities tracked, 13 saw small month-over-month declines, with Boston down the most at -0.76%. Of the six cities that were up on the month, San Diego (+0.53%) and New York (+0.40%) were up the most.
Six cities saw year-over-year gains of more than 1%, and they're all in either the northeast or midwest: Chicago (+5.7%), New York (+5%), Detroit (+4.1%), Cleveland (+3.4%), Minneapolis (+2.9%), and Boston (+1.8%).
On the flip side, the five cities that are down over the last year are mostly in the Sunbelt: Miami (-1.1%), Denver (-1.3%), Phoenix (-1.4%), Dallas (-1.4%), and Tampa (-3.9%).
Below we show month-over-month and year-over-year home price changes from today's data, along with a few additional stats like post-COVID change, % from all-time highs, and 20-year change.
Miami is up the most since COVID (February 2020) with a gain of 75.7%, while San Francisco is up the least at 31.1%. San Francisco is also down the most from all-time highs at -10.5%.
Unfortunately, not one city tracked made a new high in the latest data.
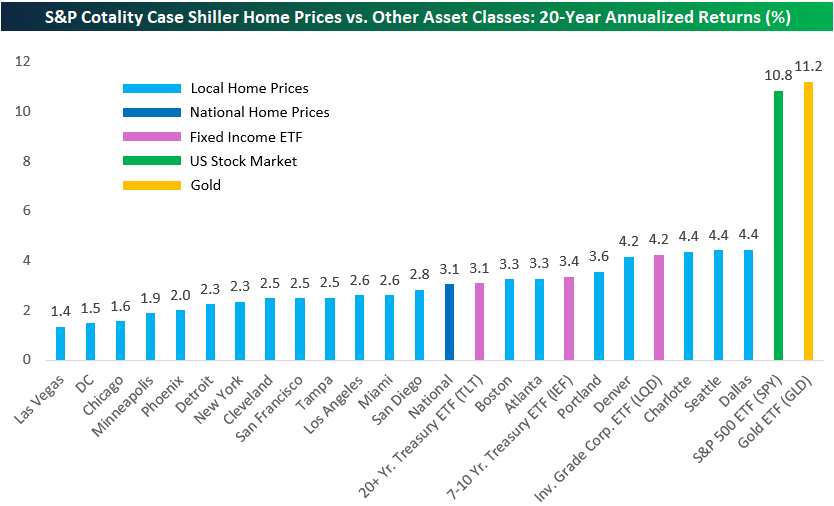
While it may seem like home prices have skyrocketed around the country, 20-year returns are actually pretty small and nowhere close to matching the returns of equities (or gold).
As shown below, most cities tracked have seen annualized home price gains of less than 3% over the last twenty years. That's worse than the 3.1% annualized return for the long-term Treasury ETF (TLT).
Only three of the twenty cities have seen home prices gain more than the investment-grade corporate bond ETF (LQD): Dallas, Seattle, and Charlotte (4.4% annualized).
Compared to the S&P 500's 10.8% annualized gains over the last twenty years and gold at 11.2%, home-price gains look puny.
(Click on image to enlarge)
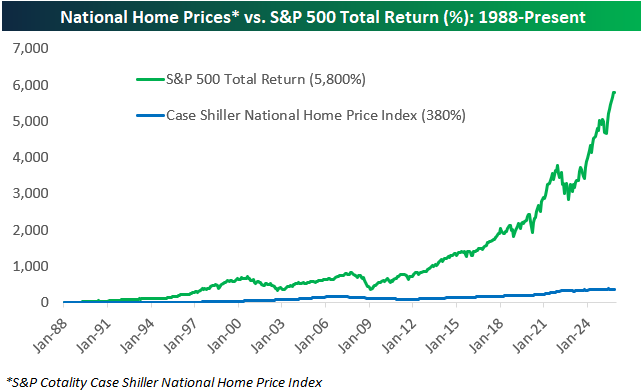
The National home price index tracked by Case Shiller goes back to the late 1980s, and as shown below, it's up 380% since 1988 versus a total return of nearly 6,000% for the S&P 500.
While there are good reasons for homeownership that include the potential for price appreciation, it's important to understand that excess capital has historically been better off put elsewhere.
More By This Author:
Country ETFs Hot Hot HotCapital One's Impressive Streak
First Year Of Trump's Second Term In The Books
Disclaimer: Bespoke Investment Group, LLC believes all information contained in this report to be accurate, but we do not guarantee its accuracy. None of the information in this report or any ...
more

