Gold Price Forecast: XAU Tanks Hard As Yields, Inflation Fears Climb
Gold Fundamental Forecast: Neutral
- Gold prices fell hard this week, losing as much as -5.43% from the Tuesday high to the Friday low.
- While recovery themes remain in full bloom, US yields have continued to climb and inflation expectations are moving, too. The big item on the calendar for next week is the Friday Non-farm Payrolls report, where there’ll likely be extra attention paid to the Average Hourly Earnings portion of the report.
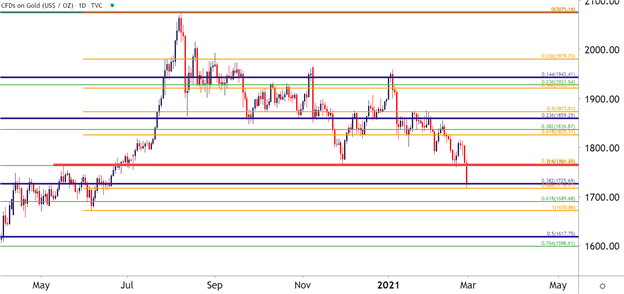
After coming into the week with a bounce, the past four days, and the past two trading days in particular, were brutal for gold bulls. Gold prices gave up more than 5% this week from the Tuesday high down to the Friday low, with FOMC Chair Jerome Powell’s Humphrey Hawkins testimony taking place in that span. And that Friday low should carry an asterisk, as the bearish move involved breaching a major area of chart support on the way to fresh seven-month-lows.
Gold Daily Price Chart: Fresh Seven-Month Low
Chart prepared by James Stanley; Gold on Tradingview
At the source of the move was a continued climb in US yields, driven by the fear that positive US economic data may eventually force the Fed to hike earlier than they might’ve hoped. And even if the Fed doesn’t hike, well, inflation fears are running rampant on the back of that positive data; and even despite the in-line PCE print on Friday, the fear of stronger inflation is unlikely to go away anytime soon.
To be clear – there is a disconnect. While inflation data looks mostly tame, and while the Fed appears rather calm around this premise, a number of other events in markets seem to run counter to that. Items like lumber, tin, or even copper are in the midst of massive bullish runs, all setting fresh highs. These are important commodities that are vital to the world’s continued growth.
The fact that raw materials are obviously inflating but the products that they go into aren’t yet showing it, at least in the observed data of CPI and PCE, is disconcerting and is likely at the source of the run higher in US Treasury yields as market participants gear up for what might be around the next corner.
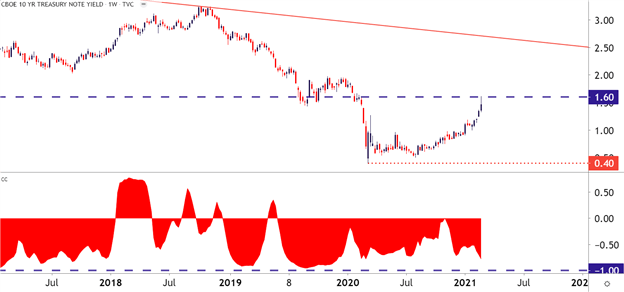
This week FOMC Chair Jerome Powell assured Congress that the Fed was going to remain loose and passive, noting that the bank wasn’t too worried about the continued climb in yields. That seemed to matter little in rates markets, as the 10-year note jumped up to another fresh high in the wake of that testimony, eventually touching a pandemic high of 1.6% before scaling back on Friday post-PCE.
The chart below is looking at yields on the 10-Year US Treasury Note, and in the bottom portion of that chart is a correlation coefficient with gold. Reads below the zero bound imply negative correlation, with a read of -1 being perfect inverse correlation. And while perfection doesn’t show, there is a general inverse drive between the two markets.
10-Year Treasure Note Yield (Weekly Chart) With Gold Correlation
Chart prepared by James Stanley; TNX on Tradingview
Gold Strategy Moving Forward
On the fundamental front, there’s little to suggest that we’ve seen the end of selling in gold. And with this week’s observation of rates continuing to rally even as Chair Powell tried to assuage fears of higher rates, well it’s unlikely that we’ve seen the end of that, either.
This will likely stay in the spotlight in the week ahead, although its not until Friday that we get next week’s most pertinent data with the Non-farm Payrolls report. The key data point to watch for in that report is the Average Hourly Earnings portion, which will indicate wage gains which point towards inflationary pressure. This can certainly impact US Treasury rates and, in-turn, gold prices.
But, on the other side of the matter, gold prices have already put in a nasty sell-off and prices are now testing some support levels that haven’t been in-play for months. So there is a valid case on the other side of the matter, especially when incorporating technical analysis which shows gold prices trying to hold support at a key Fibonacci level on the chart.
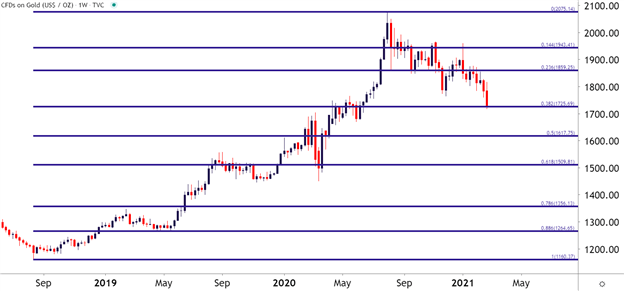
This mixed read brings on a neutral forecast for gold for the week ahead. On the chart below, we’re looking at that support level that’s just come into play this week. This is the 38.2% retracement of the 2018-2020 major move in gold; and from a technical perspective, this could be an interesting area to investigate for trend continuation potential when taking a longer-term perspective on the matter.
Gold Price Weekly Chart: 38.2 Test
Chart prepared by James Stanley; Gold on Tradingview
DailyFX Education has just launched a fresh sub-module with content dedicated to ...
more


Yes, the dip was really hard, and an important support has been reached. Reversing, gold is being pulled by silver, copper and the rest of the crowd to a degree. I though look to the real rates, which are still deeply negative = fuel for gold. Much to talk in the precious metals really...