
Gold And Silver: Heading Much Higher From Here

Image Source: Pixabay
Despite the most accessible economic environment in history, Treasury rates near all-time lows, and inflation surging to 30-year highs, gold and silver remain relatively muted in their price action. Gold and silver are flat to slightly lower over the past year, while stocks and other assets have appreciated notably.
GSMs vs. Other Major Assets
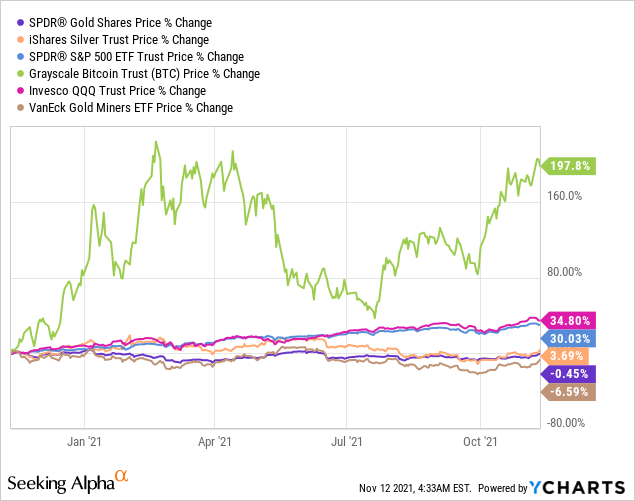
Over the past year, the Grayscale Bitcoin Trust (OTC: GBTC) has tripled, SPDR S&P 500 Trust ETF (SPY) is up by 30%, Invesco (QQQ) Trust is up by 35%, while SPDR Gold Trust (GLD), and the iShares Silver ETF (SLV) are essentially flat. Moreover, the VanEck Vectors Gold Miners ETF (GDX) is down by about 7% in this time frame.
Gold, silver, and miners ("GSMs") are underappreciated by the market right now. It seems like the broader market is significantly behind the curve on GSMs, as the gold and silver segment should do exceptionally well in a high inflationary/low-interest-rate environment. Yet, despite perpetual monetary easing, persistently high inflation, and depressed Treasury yields, GSMs have gone nowhere over the past year.
I think the market is waking up to the idea that inflation is anything but transitory and that Treasury yields are staying low for longer. Gold, silver, and the mining segment are beginning to surge, and prices should continue to move much higher from here.
The Fed's Balance Sheet Continues to Expand
I know the Fed is talking about tapering, but for now, the Fed's balance sheet continues to expand.
Fed's Balance Sheet
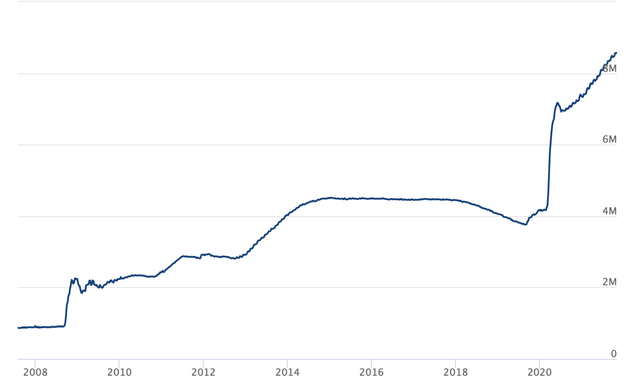
Source: federalreserve.gov
"Helicopter Money" is nothing new at this point, as we've seen numerous easing programs (QE1, QE2, the twist, now perpetual QE) since the financial crisis of 2008. The market is so used to Fed liquidity that it is difficult to imagine any meaningful growth without it in the future.
Therefore, we could be looking at QE infinity sooner than later, in my view. Nevertheless, the market treats gold and silver as if the Fed will stop printing imminently and somehow pull all the "excess liquidity" out of the market.
Is there even such a thing as excess liquidity at this point? No, I don't think so. The Fed could not successfully unwind a significant portion of its balance sheet back in 2018, and I don't believe that it ever will. Therefore, we can probably expect its balance sheet to continue expanding from here along with the U.S.'s monetary base.
Monetary Base
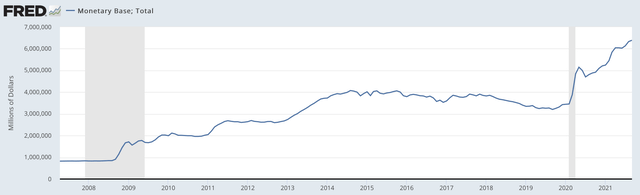
Source: stlouisfed.gov
The Fed's balance sheet and monetary base expansion directly affect inflation and have correlated with the price of gold and silver throughout history. The belief that someday soon, the easing will stop is holding back GSM prices. Inflation will prove transitory, interest rates will eventually normalize, and things will go back to the way they were before the Fed ever embarked on its QE experiment is also detrimental to prices of gold and silver. However, due to the massive debt burdening all levels of the economy, the only thing transitory will likely be the Fed's pause in QE. Interest rates may never get "normalized," and inflation is likely anything but transitory at this point.
Inflation: Anything But Transitory At This Point
Recent CPI figures released on Wednesday showed core CPI rise by 4.6% YoY, well ahead of the 4.3% estimate. In addition, if we look at non-core CPI, inflation surged by 6.2% last month, the highest level in more than 30 years.
CPI: 1990 - Now
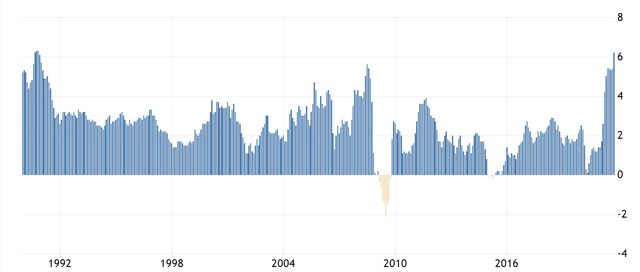
Source: tradingeconomics.com
We see that consumer inflation is heating up substantially. The rise is solid and steady, and it does not seem transitory to me. The Fed has poured immense capital into the financial system through its various QE experiments since the financial crisis. Nothing like the QE experiment has ever existed throughout history. As a result, the monetary base has ballooned by about eightfold since 2008.
PPI Inflation
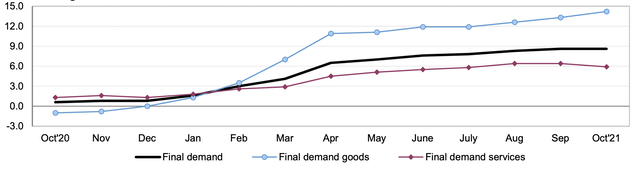
Source: bls.gov
If you think consumer inflation is getting hot, look at producer prices. PPI on final demand goods is approaching 15% now. This reading is remarkably high and illustrates that producers now pay much more in raw material costs to create consumer products. Producers are not likely to absorb excess inflation costs for long, and the rising prices will likely get passed down to consumers in higher goods pricing. This dynamic should cause consumer inflation to rise more going forward.
Again, nothing seems transitory about the current inflation environment here. If you think that the Fed can wave a wand and magically make inflation disappear going forward, I don't believe that this is the case. Therefore, inflation will likely persist, move higher, and be extremely difficult to control in future years.
PCE Inflation
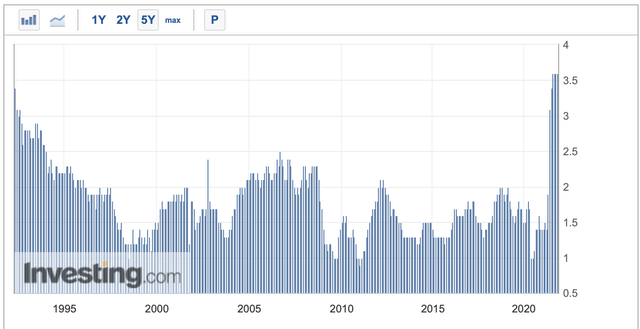
Source: investing.com
Let's look at core PCE inflation, the Fed's preferred inflation gauge:
- We see that the core PCE is also at its highest levels in around 30 years.
- We see that the core PCE has seldom strayed above the Fed's 2% target rate.
- I don't think it is coincidental that the Fed recently began to openly discuss "tolerating" inflation above 2%.
I believe that the Fed may be setting up for a "new normal," where inflation may permanently move into a higher range of 3-4% or higher.
Bonds: Staying Low For Longer
Another thing that makes gold so attractive right now is that bonds and Treasuries are at low rates. Moreover, yields are not likely moving notably higher from here.
10-year Treasury
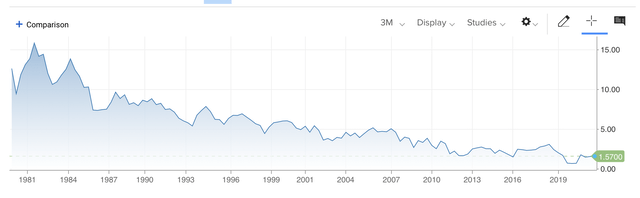
Source: cnbc.com
I mentioned that we are seeing some of the highest inflation readings in about 30 years or longer. However, we see Treasury yields at around their lowest levels on record. Back in the 1980s and 1990s, the Fed could combat high inflation with higher interest rates. Yet, this is not the case anymore. The primary reason for this is that the debt is too high. The U.S. Federal debt is at $29 trillion now, and the National debt to GDP ratio is at 126% of GDP. In comparison, debt to GDP was only at 55% in 2000 and 35% in 1980. Unfortunately, any moderate uptick in interest rates will be very detrimental to economic growth and would likely put the economy into a contraction, much like the scenario in late 2018.
Therefore, we should not see a substantial rise in interest rates and Treasury yields from here, even with inflation well above its typical 2% target rate. This high inflation/low yield is a very favorable economic dynamic for GSMs. As investors receive negative inflation-adjusted returns on many of their "safe-haven" bonds and Treasury investments, more market participants should continue to move away from pointless bond investments and into gold/silver.
A Chart is Worth a 1000 Words
Gold's been bouncing around this past year. This volatility has to do with uncertainty and the perception of the constant threat that the Fed will raise interest rates, inflation will drop, and gold will fall through the floor. However, I believe these fears are unfounded, as interest rates should remain lower for much longer, and inflation could remain high for a prolonged time frame.
Gold: 1-year
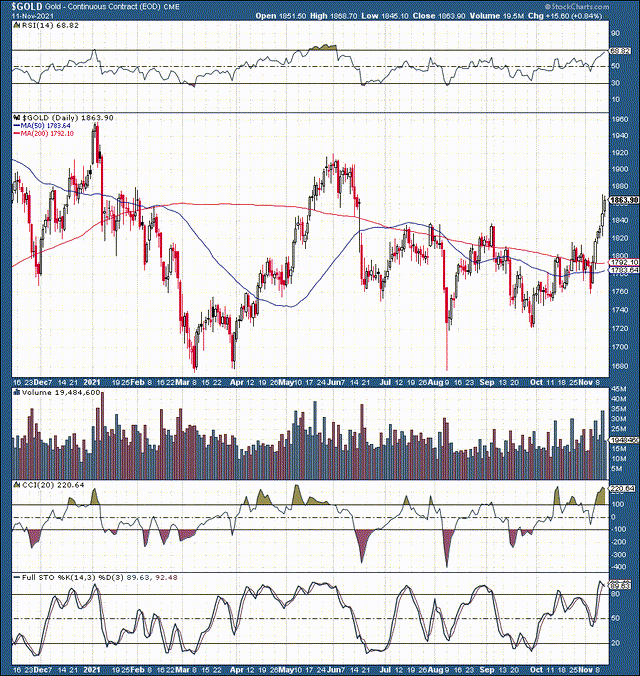
Source: stockcharts.com
It may not be apparent, but we have a bullish reverse head and shoulders pattern developing in gold. The left shoulder is lower than it should be due to the flash crash in August. However, gold came back after the crash and then successfully tested the $1,720 - 1,700 support range. Following this retest, gold came back down and tested the $1,750 - 1,760 support zone in the right shoulder of the pattern. Now we see a breakout above the neckline around the $1,820 - 1,840 point.
Silver: 1-year
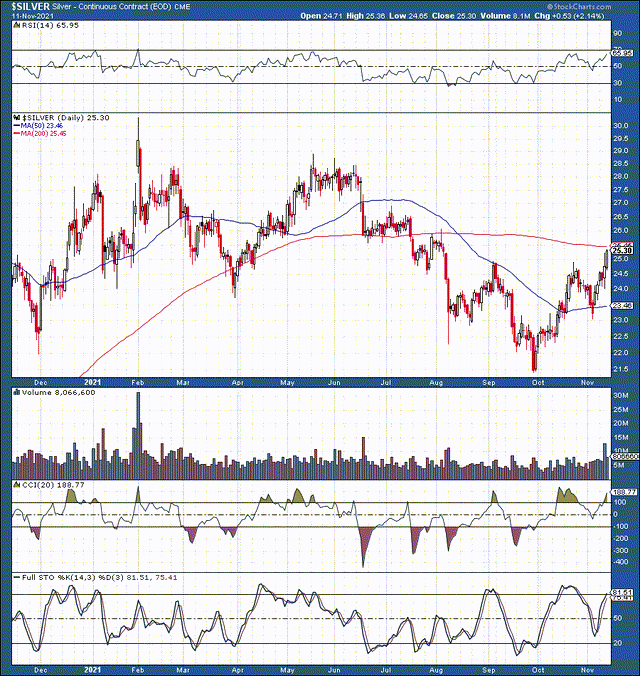
Source: stockcharts.com
Silver's reverse head and shoulder bottom is more pronounced. We see the head bottom at $21.50 and the shoulders bottom out at $23. Now, silver is moving above the $24.50-25 neckline resistance zone. The charts are bullish, and I suspect gold and silver can move notably higher from here.
The Bottom Line: GSMs Are Moving Higher
Gold and silver/GSMs have been out of favor with the market for a long time now. While stocks and other assets have surged, GSMs have remained stagnant over the last year. However, the market is not likely going to be wrong on GSMs, just late, in my view. Therefore, we could see substantial appreciation in gold, silver, and mining shares soon. The high inflation/low yield economic environment is highly favorable for GSMs, and sentiment for these assets should improve substantially going forward. Therefore, we should see substantial price appreciation in gold, silver, and mining shares as we head into year-end and 2022.
Disclosure: I/we have a beneficial long position in the shares of GDX either through stock ownership, options, or other derivatives.
Disclaimer: This article expresses solely my ...
more

