
Preparing graphs for my course, I generated this graph which shows the trend decline in real (risk free) rates. Is there any reason to believe in an imminent reversal of the trend?
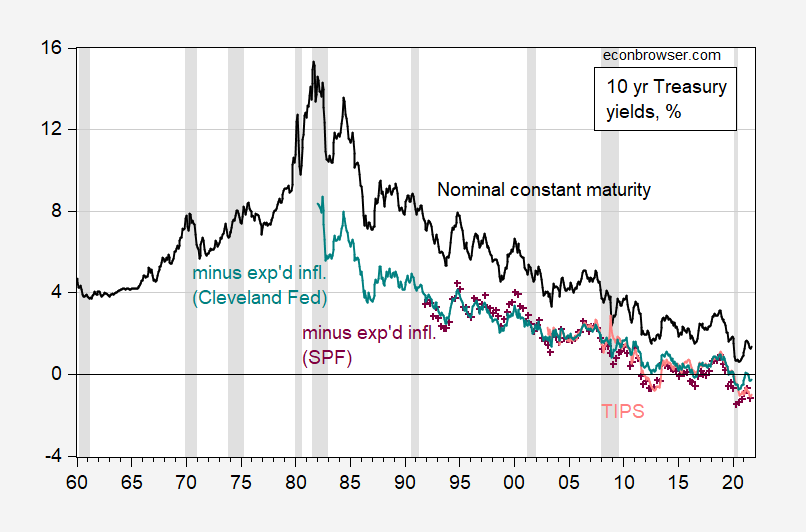
Figure 1: 10 year Treasury (constant maturity) yield (black), Treasury minus expected inflation from Cleveland Fed (teal), Treasury minus expected inflation from Survey of Professional Forecasters (purple +), and TIPS (salmon). NBER defined recession dates shaded gray. Source: Federal Reserve via FRED, Cleveland Fed, Philadelphia Fed/SPF, NBER, and author’s calculations.
it’s hard to see exactly how the estimates of the real rate differ in recent months, so here’s a detail.
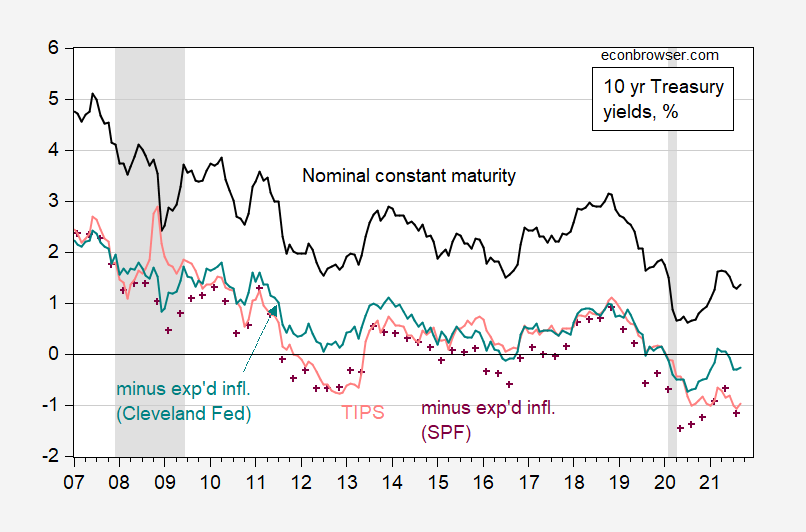
Figure 2: 10 year Treasury (constant maturity) yield (black), Treasury minus expected inflation from Cleveland Fed (teal), Treasury minus expected inflation from Survey of Professional Forecasters (purple +), and TIPS (salmon). NBER defined recession dates shaded gray. Source: Federal Reserve via FRED, Cleveland Fed, Philadelphia Fed/SPF, NBER, and author’s calculations.
Peak real rates post-recession was April 2021.


Comments
Log in or sign up to join the conversation.