
Foreseeing The “Flation” Knuckleball & Investor Implications
“Flation” Knuckleball. Foreseeing it and the investor implications.
In baseball, a knuckleball is a distinctive pitch that only a very few significant leaguers can perfect. The goal of a knuckleball is to eliminate the baseball’s spin to create erratic ball movement. Despite a much slower speed than traditional pitches, knuckleballs are among the hardest pitches to hit. However, due to its slow velocity, a batter seeing the pitch well and correctly foreseeing where it will cross the plate has an excellent chance for a hit.
The following LINK provides a few knuckleball gems.
Today our economy is throwing a “flation” knuckleball. Our job is to figure out which “flation” is coming; inflation, hyperinflation, deflation, or disinflation? Like a knuckleball, it is likely what we see today may be vastly different from what crosses the plate months from now.
Getting the current and future “flation” call right can protect your wealth. Equally valuable, if the market is wrong and you catch it offsides, the potential upside might be a home run.
In this article, we review the unparalleled forces acting on prices. Further, we share some tools we use to gauge the market’s view on inflation.
Misplaced Confidence
The overconfidence of Fed officials, economists, market mavens, and many investors is stunning, considering the unprecedented factors driving economic and market forecasts.
We share a quote from our article Soar Above Confidence To Fortify Your Wealth.
“Despite such extraordinary circumstances, the level of confidence in economic and market forecasts is remarkably high. Many “experts” forecast beautiful days with a temporary bout of above-average inflation. There is nary a mention of the potential for debilitating inflation and almost no recognition of the troubling deflationary hurricane off at sea.”
Confidence drives markets. Confidence, especially in today’s environment, can erode quickly if economic data and inflation do turn out as expected. The resulting loss of confidence can have volatile effects on many markets. It is for this reason, the odds of a fat pitch are not trivial.
A Tug of War of Price Pressures
Despite the overwhelming confidence of the Fed and economists, trying to forecast prices is more difficult today than at any time in the last 40 years due to the massive monetary and fiscal stimulus programs.
Longer-term price trends are a function of the supply and demand for money.
In Inflation- Making the Complex Simple Part 1 & Part 2, we wrote: “The truth lies in the supply and the demand for money. Unfortunately, the supply of money gets the headlines, while its demand is an afterthought.”
Fiscal stimulus increases the demand for money or velocity. Monetary stimulus, on the other hand, increases the supply of money. To reiterate, price changes result from the change in money supply AND the change in monetary velocity.
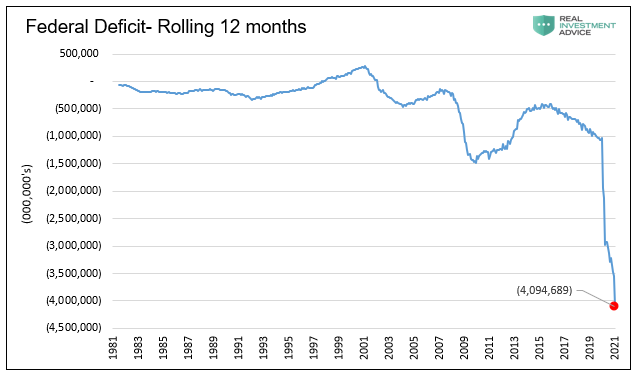
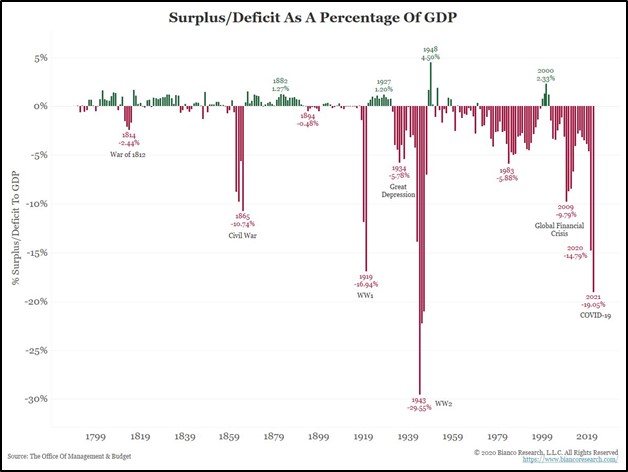
Over the past 12 months, the U.S. government ran a $4 trillion deficit. As shown below, it is off the charts on an absolute basis. Even more startling, as shown in the second graph, the only time in United States history the government spent more as a percentage of GDP was during World War II.
Despite the massive fiscal stimulus, monetary velocity is rapidly slowing as consumers and corporations elect to save. Simply, the money is not recirculating through the economy as quickly as might be expected.
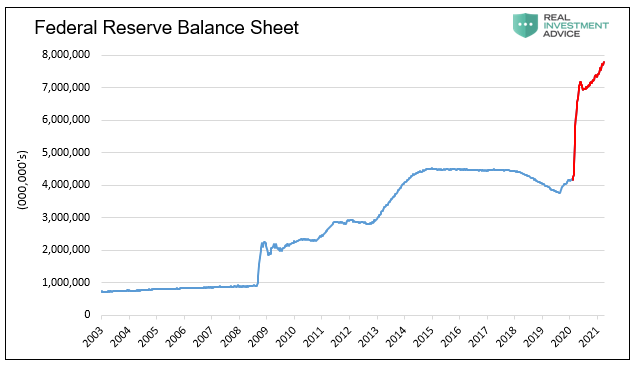
The monetary supply side of the equation is equally shocking. The Fed’s balance sheet increased by nearly $4 trillion since February 2020. In one year, the Fed bought more assets than they did during the 2008 Financial Crisis and subsequent rounds of QE. They are currently buying $120 billion of assets a month despite a robust economic recovery.
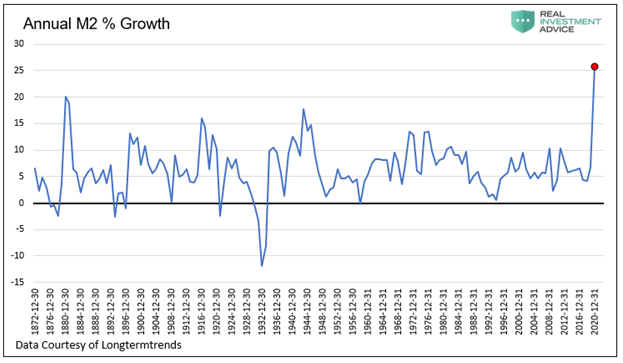
As a result of the Fed’s actions, the supply of money (M2) is surging higher, as shown below. The change represents, by far, the most significant one-year increase since the Civil War.
Temporary Price Pressures
As if assessing the effects of immense fiscal and monetary stimulus was not enough, we must consider most foreign central banks and governments are taking similar stimulus actions.
Further, vaccine distribution is ramping up quickly, and the economic recovery is taking hold, thereby unleashing pent-up demand. The result is not only greater consumption but a change in consumption habits.
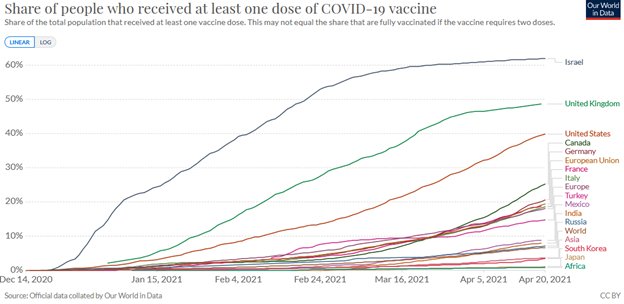
To add more fuel to the fire, supply lines for many products are fractured and not fully operating as quickly as demand increases. Worse, many nations we import from are still struggling to contain the virus. As shown below, the pace of vaccinations in the U.S. is well above all other developed economies except Israel and the U.K.
The tug of war of price pressures is immense, making it extremely difficult to predict their temporary and permanent effects on prices.
Given these historical anomalies, it is crucial to stay open-minded on the inflation debate, as we recently wrote in Soar Above Confidence To Fortify Your Wealth. But, equally important, pay close attention to market-based inflation gauges to understand the market’s opinion.
Implied Inflation Gauges
TIPs
The difference between the yields on nominal and inflation-protected (TIPS) Treasury bonds provide investors with market-implied inflation expectations. TIPS holders receive compensation for inflation, and nominal bondholders do not. Therefore, the difference between their yields equals the rate of implied future inflation that would make bondholders indifferent between holding the two types of bonds.
The graph below shows the 5-year implied inflation rate described above and the 5-year implied inflation rate for the five years starting five years from now. Such is called the five-year, five-year forward rate or 5×5.
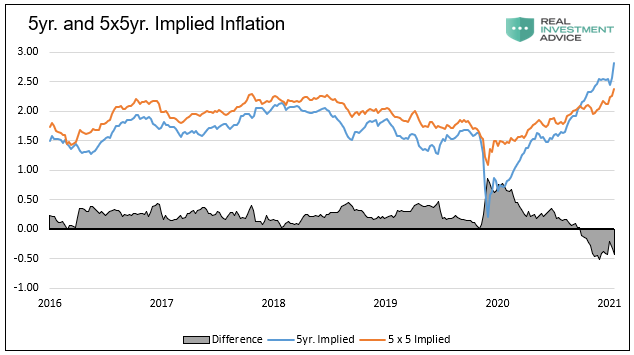
Five-year implied inflation is hovering at 2.80%, well above its highest level of the last five years. 5×5 implied inflation is close to 2.40% and near the peaks of the previous five years. The current period marks the first time since 2008 when the difference between the two measures was negative. The inversion of the implied inflation curve tells us the market thinks there will be a spurt of inflation in the near term, but it will be transitory.
Fed’s Inflation Model
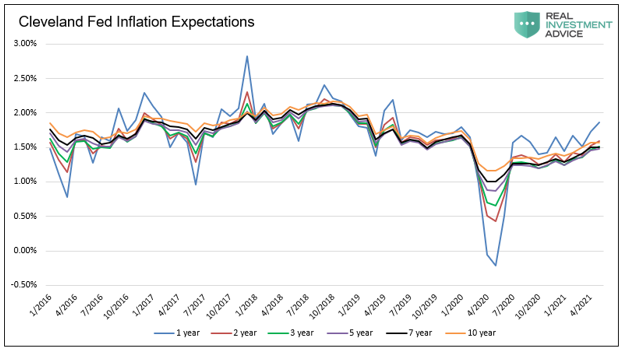
The Cleveland Fed publishes a monthly multi-factor expected inflation model. Per the Cleveland Fed:
“We calculate our estimates with a model that uses Treasury yields, inflation data, inflation swaps, and survey-based measures of inflation expectations.”
Their model shows inflation expectations through the next ten years are anchored at or below levels preceding COVID. The 1-year inflation expectation, at 1.85%, is higher than longer-term expectations. Like implied expectations, comparing shorter-term to longer-term expectations points to transitory inflation but not lasting inflation.
Equity Markets
While the equity markets do not give us clear indications of expected inflation rates as the models above, they provide clues. In RIA Pro, we provide our subscribers weekly analysis on an index we created to help assess the equity market’s opinion on the inflation/deflation trade.
Our index compares certain “inflationary” and “deflationary” S&P 500 sectors. When the index rises, it denotes inflationary stocks are outperforming deflationary stocks. The graph below compares implied 5-year inflation expectations, as discussed, with the inflation/deflation index. When implied inflation rates increase, as highlighted in beige, the index rises. Such denotes the inflation sectors are gaining ground to the stable/deflationary price sectors.
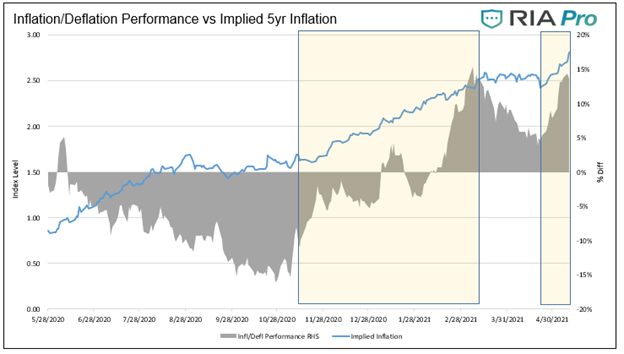
Currently, the equity markets warn of rising inflationary pressures.
Currency Markets
Australia is a large commodities producer and exporter. As such, a large majority of their trade occurs in U.S. dollars. Because of this, the value of the Australian dollar (AUD) versus the U.S. dollar is tied closely to inflation expectations.
The chart below compares the AUD, and U.S. 5-year implied inflation levels. The correlation (R-squared) over this period is significant at .56.
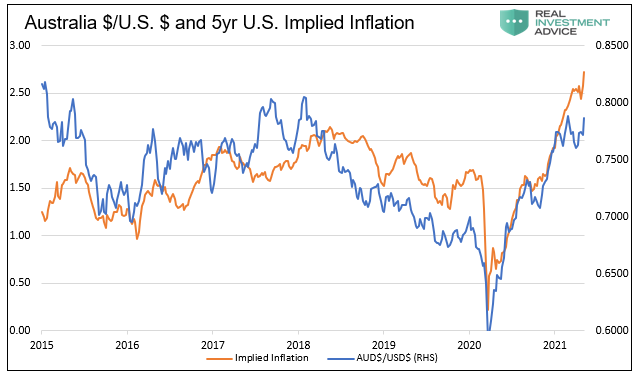
Since January 1, 2021, the AUD has been range-bound, while implied inflation is up by 0.75%. Either the correlation may be temporarily breaking down, or the AUD is warning that U.S. bond traders have lofty inflation expectations.
In addition to the inflation expectations described already, there are many other assets to help assess the market’s inflation view. Further, a host of consumer, corporate, and manufacturing surveys illuminate broader inflation expectations.
We would be remiss if we did not separately mention Bitcoin and Crude Oil as they have recently shown a solid correlation to inflation expectations.
Summary
As we stated in the opening, there is a home-run trade in the making if you get the “flation” trade right and the market is wrong on its outlook. Like hitting an erratic knuckleball, locating such a fat pitch is extremely difficult but very rewarding.
Markets are pricing in transitory inflation. We currently believe they are right. However, we do not think markets are ready for a resumption of deflationary forces or a more pronounced outbreak of inflation. It is these two outliers where a fat pitch may lie.
Disclaimer: Click here to read the full disclaimer.


