
CoT - Peek Into Future Through Futures, How Hedge Funds Are Positioned
Following futures positions of non-commercials are as of May 16, 2023.
10-year note: Currently net short 692.4k, down 39.3k.
(Click on image to enlarge)
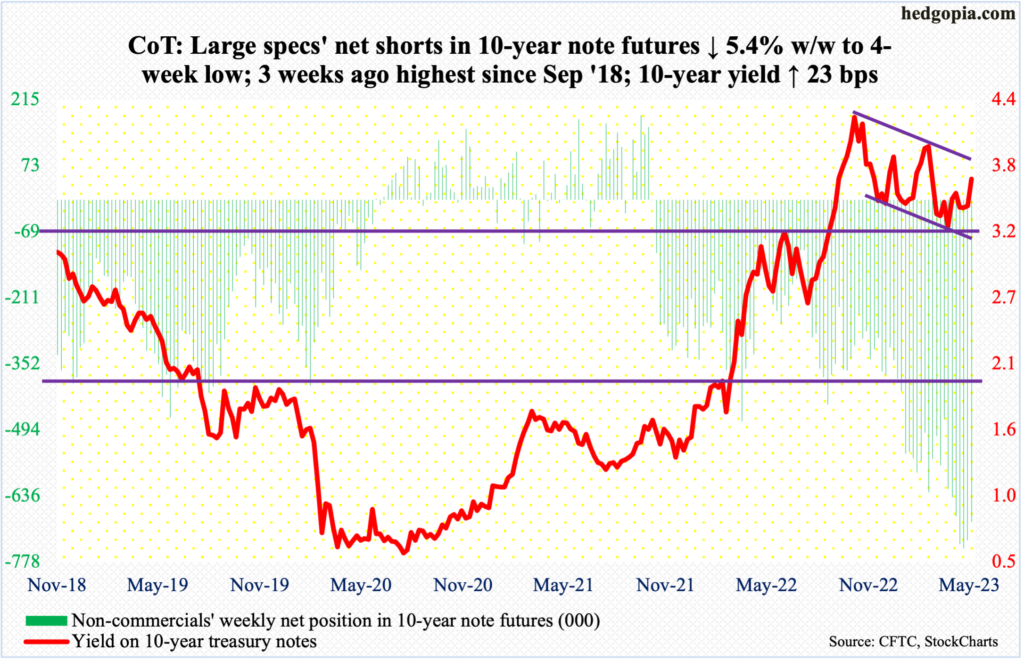
FOMC minutes for the May 2-3 meeting are due out next Wednesday. The fed funds rate was raised by 25 basis points in that meeting to a range of 500 basis points to 525 basis points. Both the post-meeting statement and Chair Jerome Powell at the press conference dropped hints that they would be pausing. In March last year, the benchmark rates were zero to 25 basis points.
The next meeting is on June 13-14. By then, FOMC members will also have May’s CPI (consumer price index) – due out on June 13 – at their disposal. (April’s PCE is scheduled for next Friday.) These reports can influence their decision. Powell this week said future decisions would be data-dependent as opposed to being on a preset course.
More important is markets’ inability to listen. In the futures market, traders continue to expect cuts this year. Powell and his team have made it loud and clear that they see no easing this year. Until last week, these traders expected three 25-basis-point cuts this year, ending the year between 425 basis points and 450 basis points. This has now been reduced to two cuts, ending 2023 at 450 basis points to 475 basis points. Odds favor the gap between the Fed language/guidance and futures traders will continue to narrow in the weeks/months ahead. Powell will win this staring contest.
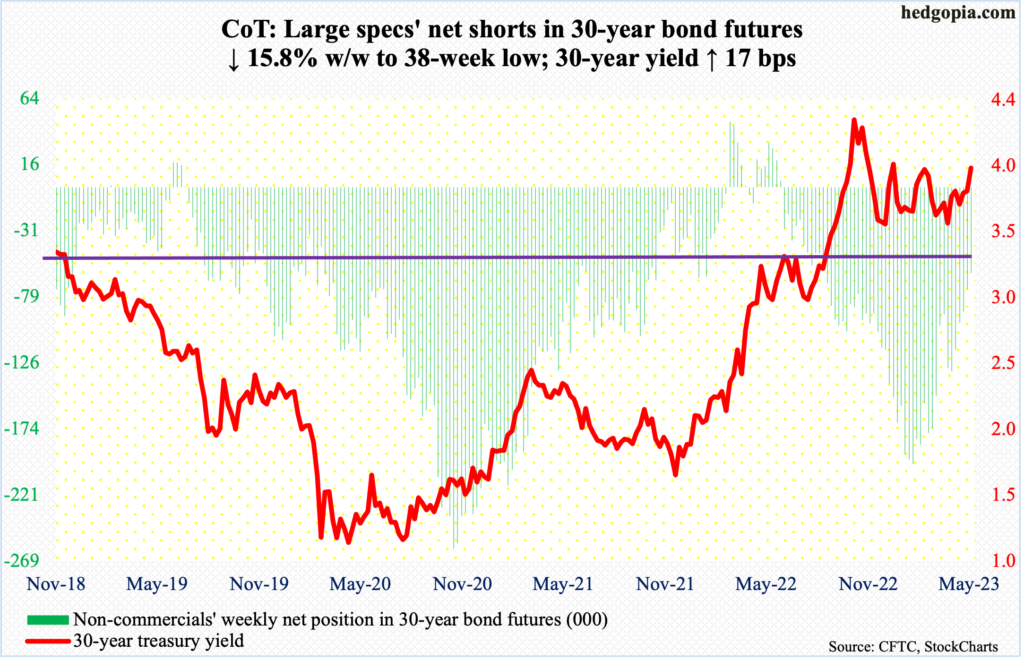
30-year bond: Currently net short 61.6k, down 11.5k.
(Click on image to enlarge)
Major economic releases for next week are as follows.
New home sales (April) are scheduled for Tuesday. In March, sales of new homes jumped 9.6 percent month-over-month to a seasonally adjusted annual rate of 683,000 units – a one-year high.
Thursday brings GDP (2nd print, 1Q23) and corporate profits (1Q23).
The first print showed real GDP grew 1.1 percent in 1Q (SAAR). This represents deceleration from growth of 2.6 percent in 4Q22 and 3.2 percent in 3Q. Before that, the economy contracted back-to-back in two quarters – by 0.6 percent in 2Q and 1.6 percent in 1Q.
In 4Q22, corporate profits adjusted for inventory valuation and capital consumption dropped two percent quarter-over-quarter to $2.94 trillion (SAAR). The record high $3 trillion was hit in 2Q22.
On Friday, durables goods orders (April), personal income/spending (April) and the University of Michigan’s consumer sentiment index (May) are on dock.
March new orders for non-defense capital goods ex-aircraft – proxy for business capex plans – declined 1.1 percent m/m to $72.7 billion. Last August, the series peaked at $73.7 billion.
In the 12 months to March, headline and core PCE (personal consumption expenditures) rose 4.2 percent and 4.6 percent. They respectively peaked last year at seven percent in June and 5.4 percent in February. The Fed targets two percent on core PCE.
May’s preliminary reading showed consumer sentiment tumbled 5.8 points m/m to 57.7. Last June’s 50 was the lowest on record.
WTI crude oil: Currently net long 221.8k, down 4k.
(Click on image to enlarge)
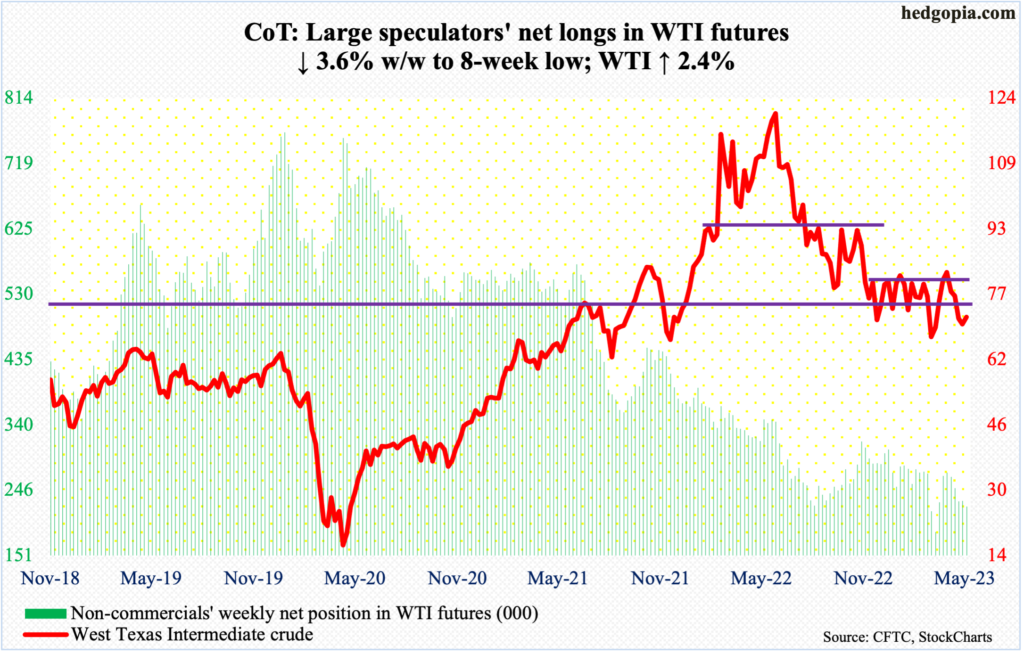
WTI ($71.69/barrel) rose 2.4 percent this week to try to slide back into a five-plus-month range between $71-$72 and $81-$82. This week’s rally followed four consecutive weekly losses.
For four weeks now, the crude has had trouble penetrating $74, and that continued this week. Oil bulls are struggling to build on momentum. In the right circumstances for oil bears, bulls’ mettle will be tested at $63-$64.
In the meantime, as per the EIA, US crude production in the week to May 12 decreased 100,000 barrels per day week-over-week to 12.2 million b/d. Crude imports increased 1.3 mb/d to 6.9 mb/d. As did stocks of crude and distillates, which grew five million barrels and 80,000 barrels respectively to 467.6 million barrels and 106.2 million barrels. Gasoline stocks, however, declined 1.4 million barrels to 218.3 million barrels. Refinery utilization rose one percentage point to 92 percent.
E-mini S&P 500: Currently net short 388.7k, up 12.7k.
(Click on image to enlarge)
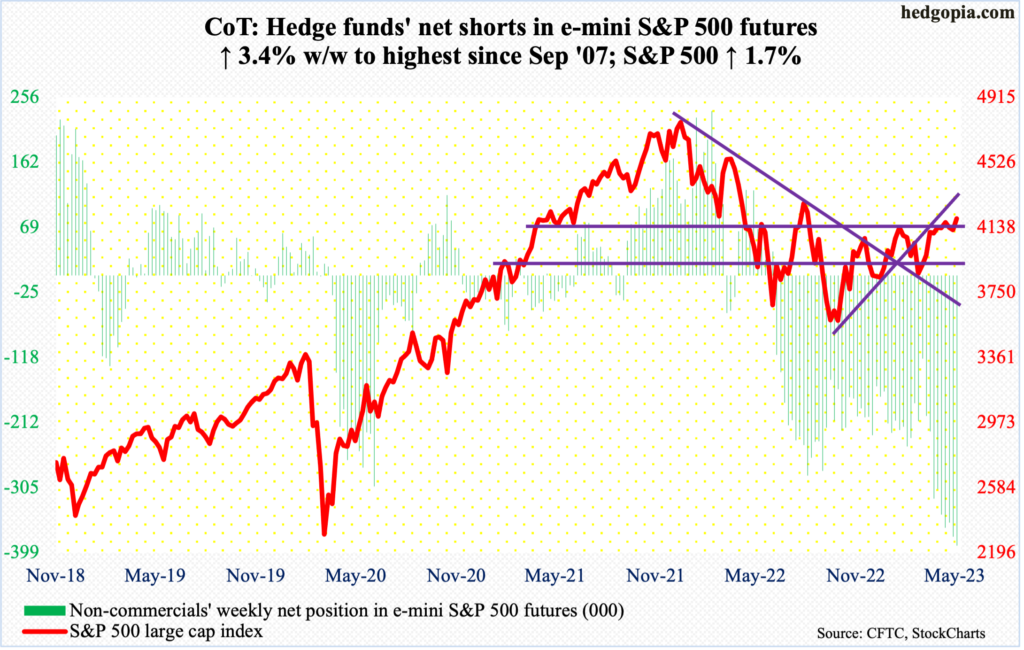
Non-commercials are not letting up. By Tuesday, they were net short 388,721 contracts. This is the most net short they have ever been since September 2007. Back then, they accumulated 408,653 net shorts before cutting. It was a very profitable trade for them back then. The S&P 500 peaked at 1576 in October that year and by March 2009 had tumbled to 667.
History does not repeat itself, but it often rhymes, as the saying goes. At least the bulls hope things would turn out differently this time. They do have an opportunity to squeeze the shorts. As a matter of fact, the S&P 500 did rally 2.5 percent from Tuesday’s close to Friday’s intraday high of 4213. We will find out next week when the next CoT report comes out if short squeeze played a role in this. Thus far, shorts are staying put.
Bulls do deserve kudos in their ability to take out nearest resistance at 4170s-4180s. This followed a reclaiming of 4100 in late March. They should be given the benefit of the doubt as long as the index (4192) remains above this level.
Near-term, the daily is beginning to get extended.
Euro: Currently net long 187.1k, up 7.7k.
(Click on image to enlarge)
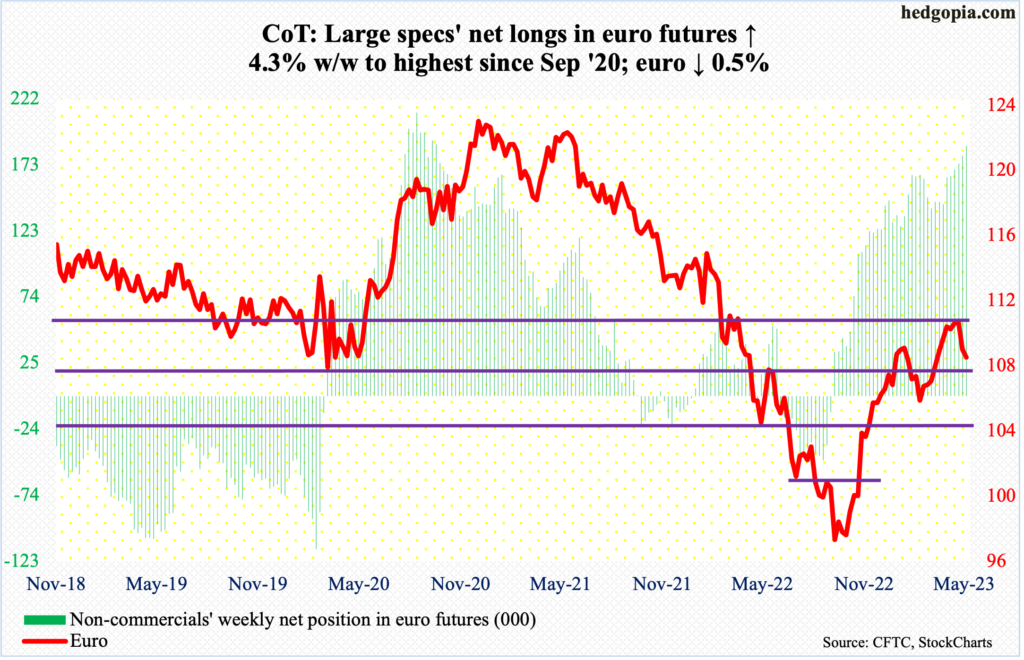
Last week, after three straight weekly spinning tops, the euro gave back 1.5 percent. This week, it fell another 0.5 percent, also slicing through a rising trend line from last September when the currency bottomed at $0.9559. The weekly has more room to come under pressure.
Despite this, euro bulls do have an opportunity to put their foot down here. Thursday’s intraday low of $1.0763 tested horizontal support at $1.07-$1.08. The daily can rally. In this scenario, immediate resistance lies at $1.09-$1.10, which repelled rally attempts for five weeks before last week’s drop. The euro closed out the week at $1.0812.
Gold: Currently net long 179.8k, down 16k.
(Click on image to enlarge)
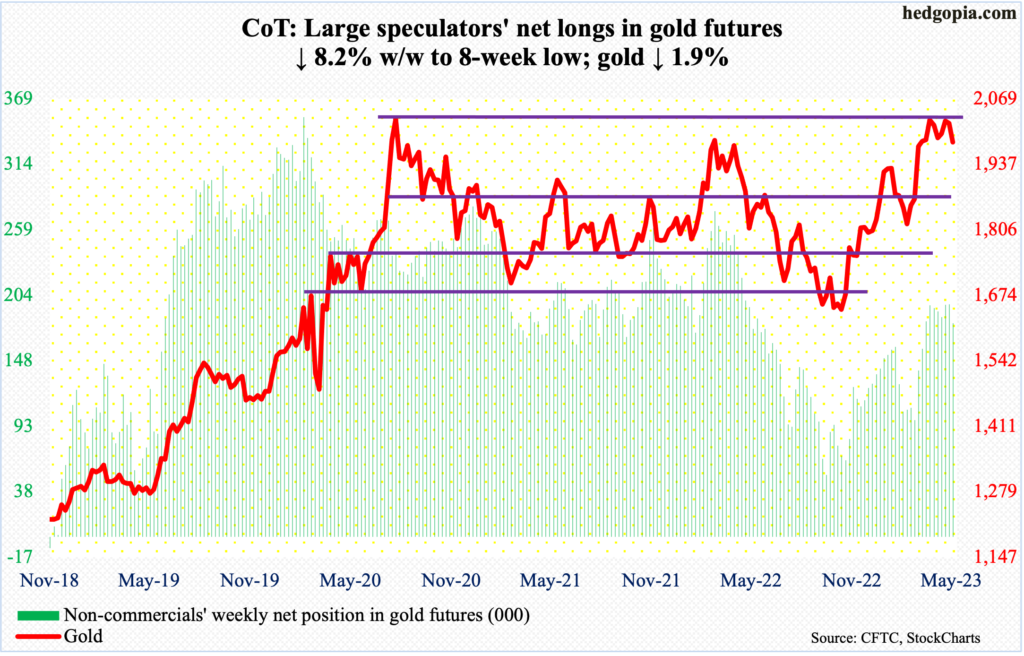
After repeatedly failing at prior major highs, gold ($1,982/ounce) this week dropped 1.9 percent to close under the 50-day moving average ($1,995).
In August 2020, the metal ticked $2,089 before retreating sharply. In March 2022, $2,079 was tagged and, once again, the reversal was sharp. This time around, gold touched $2,085 on the 4th this month and this took place in a spinning top session.
There was lateral support at $1,970s-$1,980s and this is holding, although the yellow metal dropped all the way to $1,954 on Thursday.
Non-commercials have decent net long exposure. Gold bugs hope these traders do not start reducing their holdings.
Nasdaq 100 index (mini): Currently net long 20k, down 1.4k.
(Click on image to enlarge)
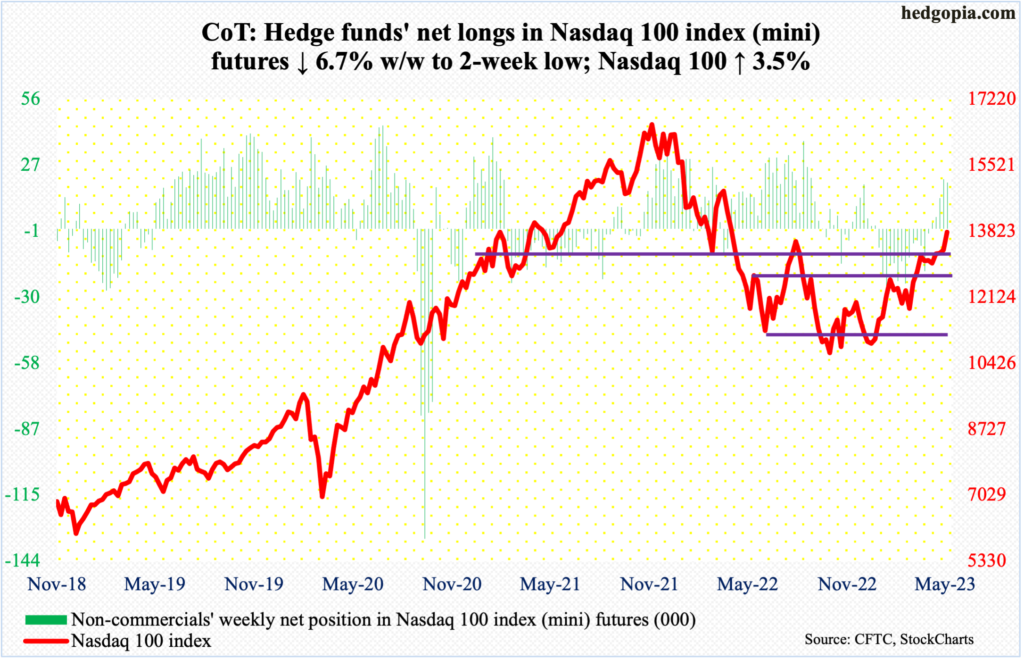
Non-commercials switched to net long in the week to April 18 and have stayed net long for five weeks now. It has been a profitable trade.
The tech-heavy index was rejected/went sideways at 13100s for four weeks before it poked its head out four weeks ago; last week’s intra-week drop to that level attracted bids. The Nasdaq 100 shot up 3.5 percent this week to 13803.
Tech momentum is strong, but the daily is way extended.
Russell 2000 mini-index: Currently net short 64k, up 4.3k.
(Click on image to enlarge)
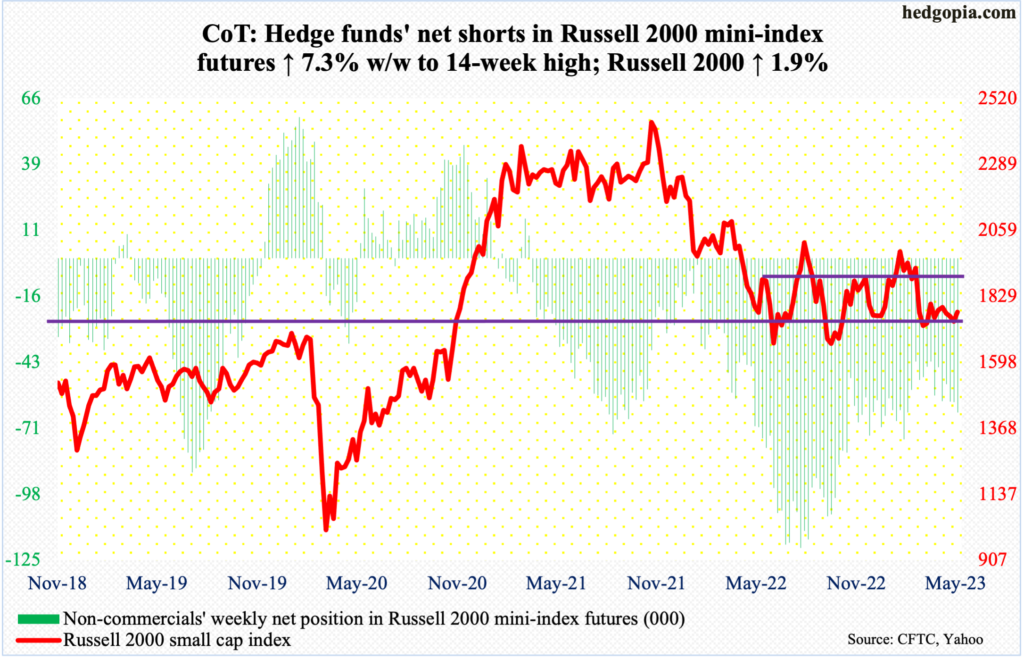
With a rise of 1.9 percent this week, the Russell 2000 closed right between the 200- and 50-day (respectively 1821 and 1763).
The small cap index has been rangebound between 1900 and 1700 since January last year. The past two months, it has struggled to push through 1800 – the mid-point of the range – including Friday when 1801 was tagged intraday but only to close at 1774.
For now, the range has narrowed to between 1800 and 1700.
US Dollar Index: Currently net long 9.5k, down 1.6k.
(Click on image to enlarge)
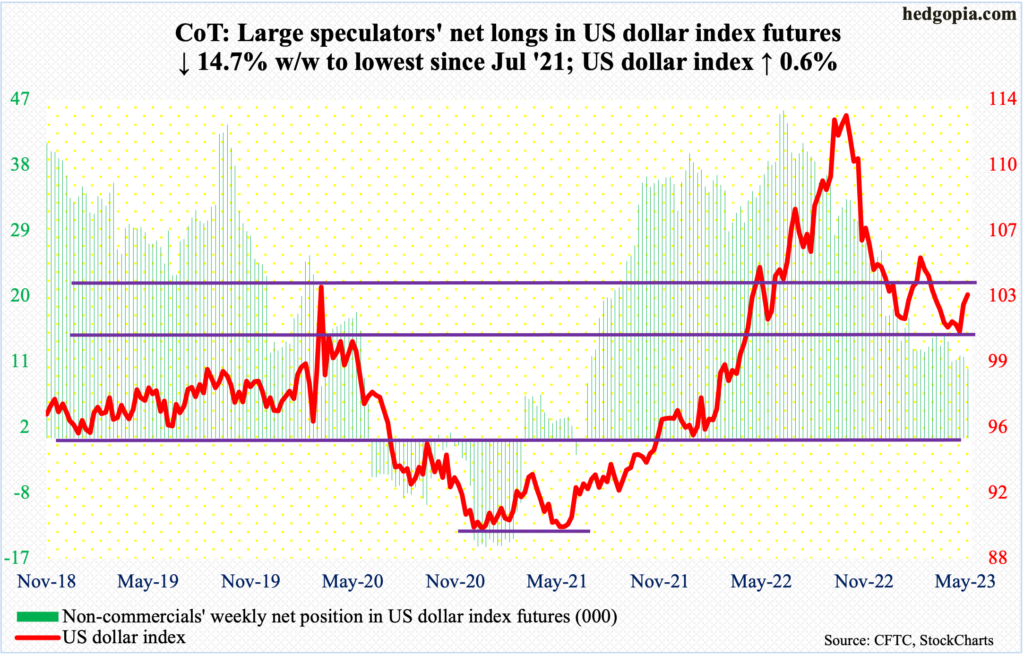
After four weeks of sideways action at 100-101, wherein lies eight-year horizontal support, the US dollar index jumped 1.5 percent last week. This week, it rallied another 0.6 percent to 103.08, with both Thursday and Friday tagging 103.49. This is going to be a test of dollar bulls’ mettle.
Support-turned-resistance at 103-104 was lost mid-March. The index broke out of this level last June, subsequently tagging 114.75 in September, before reversing. How it behaves here will be telling. The daily is overbought.
VIX: Currently net short 54.4k, down 13.5k.
(Click on image to enlarge)
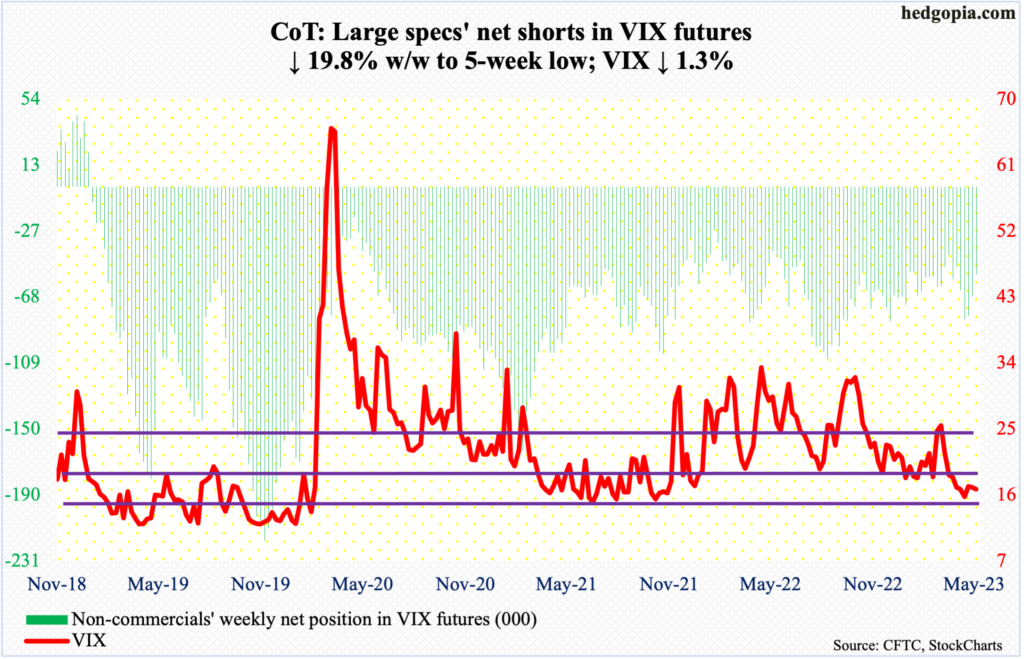
A rising trendline from November 2017 when the volatility index reached an all-time low of 8.56 is broken, but ever so slightly. VIX (16.81) arguably is sitting right on this line, hence its significance.
This trendline has mid- to long-term significance. More near-term is 18, which has rejected volatility bulls’ rally attempts for a month now.
More By This Author:
As 1Q23 Earnings Season Ends, Large-Caps Fare Better Than Mid- To Small-Caps
Futures Positions Of Noncommercials From COT Report This Week
15-Month Range Support Once Again Tested


