Commitment Of Traders This Week, How Non-Commercials Are Positioned
Following futures positions of non-commercials are as of June 29, 2021.
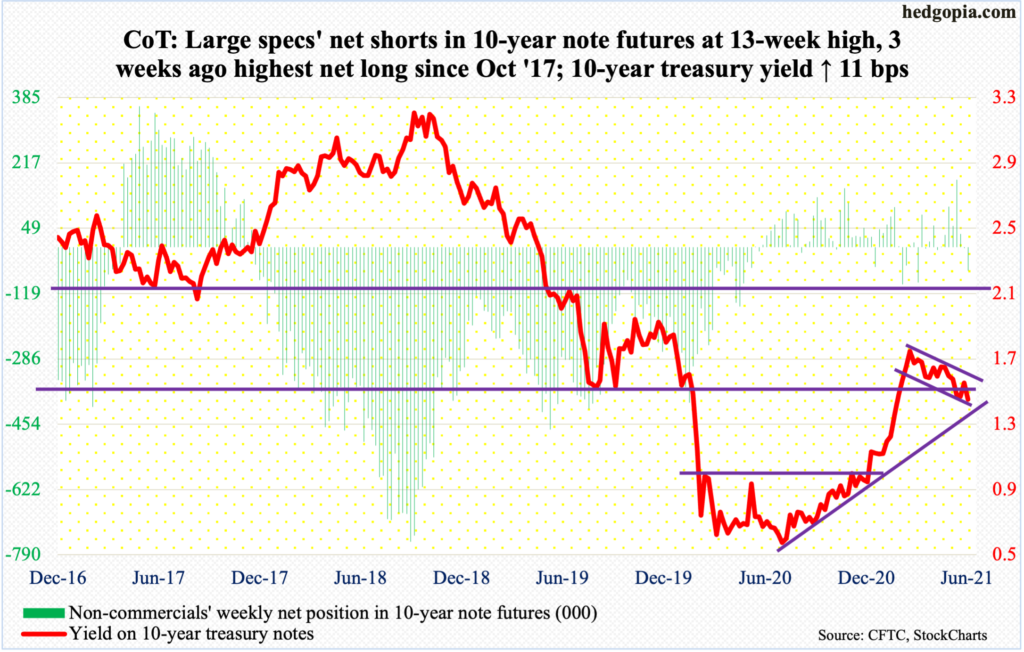
10-year note: Currently net short 60k, up 57.6k.
FOMC minutes for the June 15-16 meeting are due out next Wednesday. The meeting was a surprise to the markets in that members brought forward their projections for interest rate hikes into 2023, with 11 of them penciling in at least two quarter-point increases for 2023.
Since then, both sides – hawks and doves – have been actively putting forward their arguments. Leading doves such as Chair Jerome Powell and John Williams, president of the New York Fed which has a permanent voting seat, argue that it is too soon to dial back the ongoing monetary stimulus. District presidents Robert Kaplan, James Bullard and Raphael Bostic – Texas, St. Louis and Atlanta respectively – argue that the time to pare back the bond-buying program is growing closer. Bostic sees a rate liftoff next year.
Bostic is a voting member this year, but will not vote next year. Bullard becomes a voting member next year and Kaplan the year after.
This week, one more voice got added to the hawkish camp. Christopher Waller, a governor, opined that they may need to taper as soon as this year so rates can begin to lift off next year.
Currently, the Fed funds rate is zero-bound between zero and 25 basis points. Additionally, the Fed spends up to $120 billion a month in bond purchases – $80 billion in treasury notes and bonds and $40 billion in mortgage-backed securities. The balance sheet has grown from $4.24 trillion in early March last year to $8.13 trillion.
As things stand, doves are in the majority, but the debate is shifting toward tapering/tightening sooner than previously expected.
Given these latest dynamics, it is hard to imagine anything shocking coming out of next week’s minutes.
Amidst all this, and amidst all the inflation talk, the 10-year yield cannot rally – sitting on triple support (more on this here). Either bond vigilantes are not convinced inflation is a genuine concern or they are beginning to price in economic slowdown induced by earlier tightening of monetary policy.
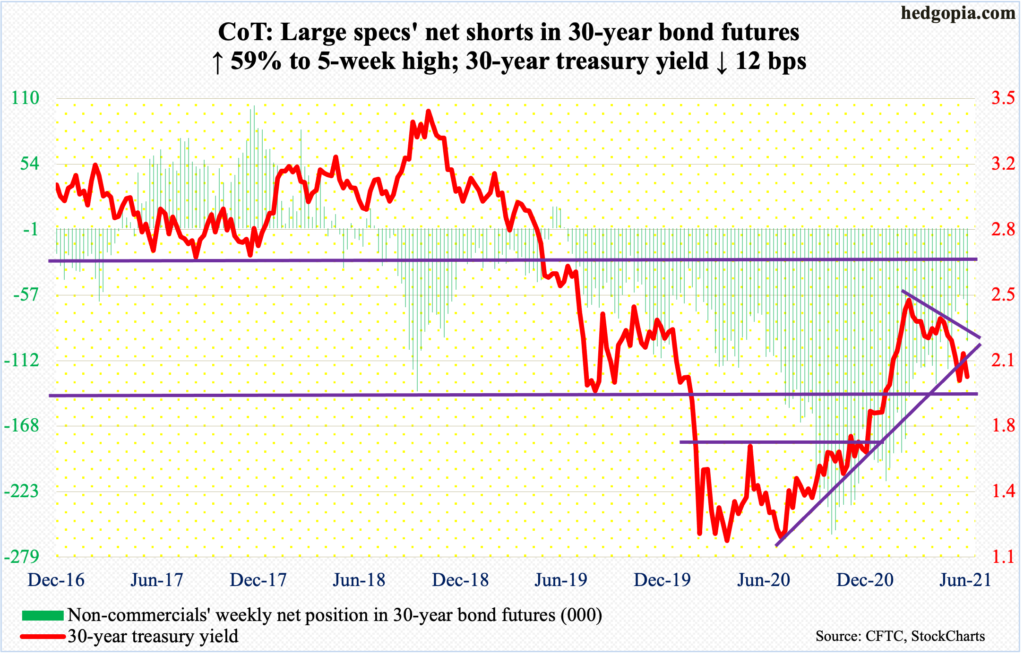
30-year bond: Currently net short 96k, up 35.6k.
Major economic releases for next week are as follows. Markets are closed on Monday for observance of Independence Day. Happy July 4th!
The ISM non-manufacturing index (June) is due out on Tuesday. In May, services activity was up 1.3 points month-over-month to 64 – a third straight reading north of 60.
Wednesday brings JOLTs job openings (May). Non-farm openings in April surged 998,000 m/m to 9.3 million – a new record.
WTI crude oil: Currently net long 550.1k, down 8.5k.
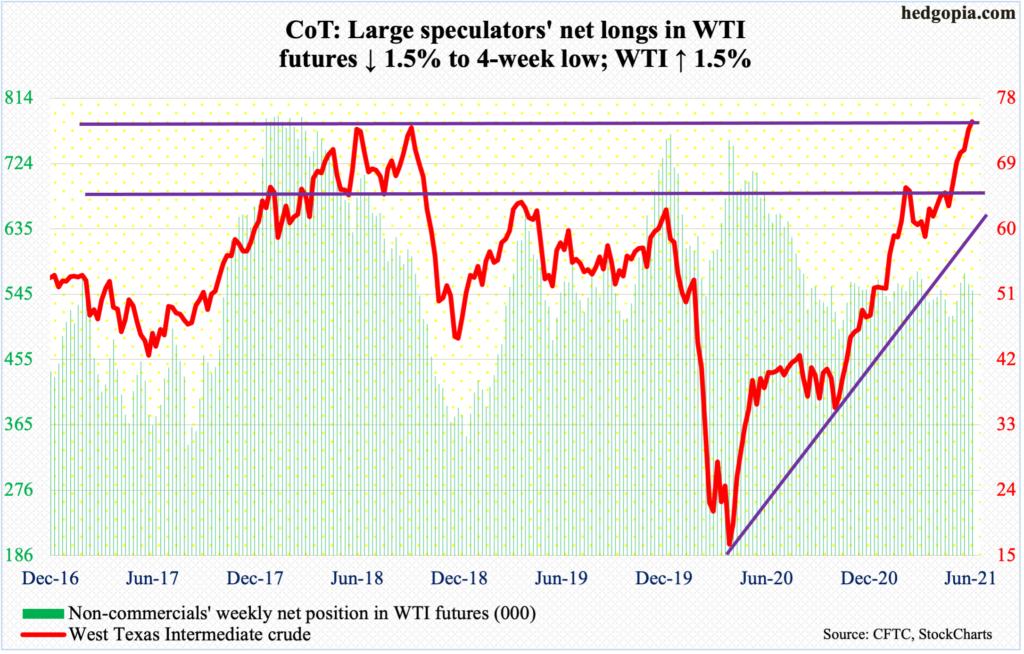
On Thursday, WTI ($75.16/barrel) came within $0.68 of the October 2018 high of $76.90, although it failed to keep all the gains, closing at $75.23; the session’s candle with a long upper shadow was preceded by Wednesday’s doji and Tuesday’s spinning top. Friday ended with a doji.
This is a very important test. The crude has come a long way, having bottomed at $6.50 in April last year. It remains overbought on nearly all timeframes. The daily in particular has remained overbought after $66-$67 was taken out early last month. In due course, a retest of that breakout will happen and will probably decide the direction of the next major move.
In the week to June 25, US crude production was unchanged at 11.1 million barrels per day. Crude imports, however, dropped 537,000 b/d to 6.4 mb/d. As did stocks of crude and distillates, which respectively fell 6.7 million barrels and 869,000 barrels to 452.3 million barrels and 137.1 million barrels. Refinery utilization increased seven-tenths of a percentage point to 92.9 percent. Gasoline stocks rose 1.5 million barrels to 241.6 million barrels.
E-mini S&P 500: Currently net long 55.2k, down 4.2k.
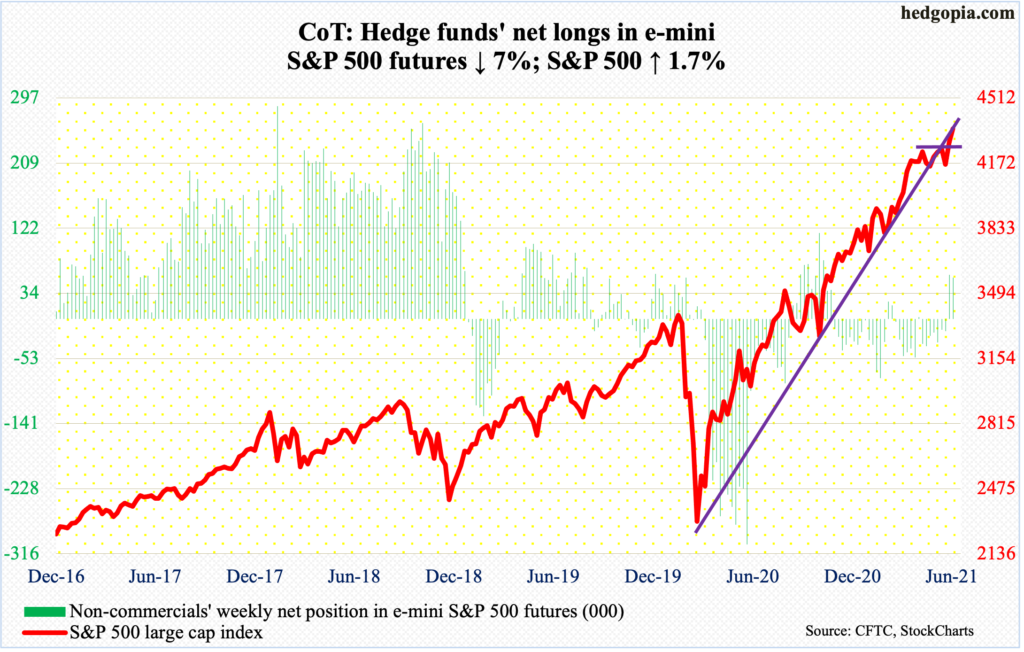
Equity bulls this week further built on last week’s 4250s breakout. Up 1.7 percent this week, the S&P 500 has now rallied for seven straight sessions – and in nine out of the last 10. When the large cap index tested its 50-day moving average two weeks ago, the daily Bollinger bands had narrowed quite a bit; they are now opening up, with the index rallying all along the sharply rising upper band.
Flows are in full cooperation. US-based equity funds in the week to Wednesday pulled in $6 billion (courtesy of Lipper). In the same week, SPY (SPDR S&P 500 ETF), VOO (Vanguard S&P 500 ETF) and IVV (iShares Core S&P 500 ETF) took in $5.5 billion (courtesy of ETF.com). In the prior week, inflows were $10 billion and $3.8 billion, in that order.
In the meantime, since peaking four weeks ago, money-market funds have come down by nearly $85 billion to $4.53 trillion (courtesy of ICI). It seems at least some of it has found its way into stocks. The so-called cash-on-the-sidelines remains massive and can be a source of tailwind for stocks should money continue to leave these funds. It is a big if, given how far the S&P 500 has come, having nearly doubled from the low of March last year.
For now, the next time the index (4352) comes under pressure, bulls have decent support at 4250s.
Euro: Currently net long 87.1k, down 1.9k.
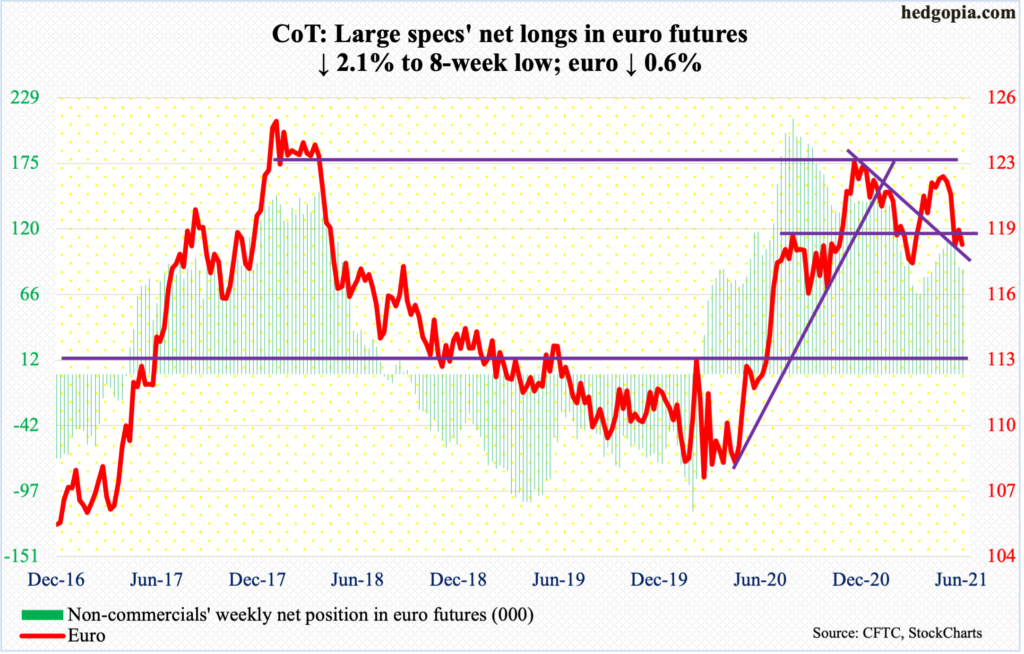
Last Friday’s failed retest of broken support at $1.19-$1.20 is proving costly. The support goes back 18 years and was breached on June 17. Last Friday, the euro ticked $1.1976 before weakening. This week, the currency ($1.1867) fell in the first four sessions, while Friday’s early drop to $1.1807 was bought.
The daily is oversold and could be itching to rally. At this point in time, a drop to the March 30 low of $1.1712 is a worse-case scenario.
Gold: Currently net long 162.2k, down 4k.
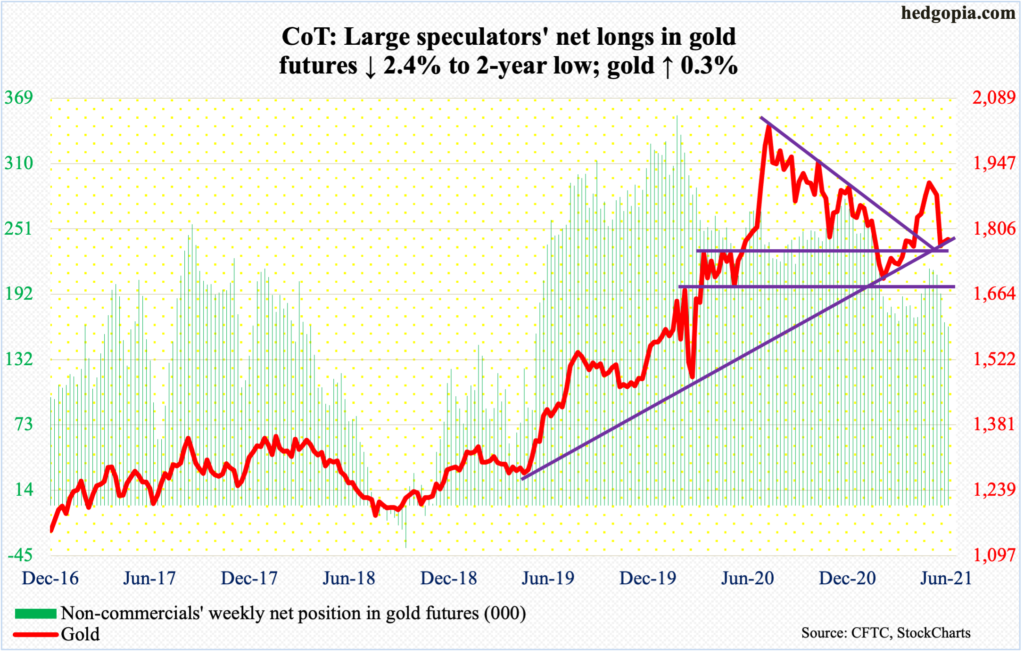
Another week of sideways action around crucial horizontal support at $1,760s-$1,770s. After getting rejected several times at $1,920s in the first half last month, gold ($1,783/ounce) quickly lost the 200-day to land on $1,760s-$1,770s. This support goes back to the latter months of 2011.
On Tuesday (this week), the metal fell as low as $1,750 before bids showed up. The sideways action over the last couple of weeks should help shorter-term averages flatten out. The daily remains oversold. Right here and now, rally odds outweigh breach risks. Should $1,760s-$1,770s give way, the yellow metal can hurriedly drop toward $1,670s, which is where it bottomed in March.
Nasdaq 100 index (mini): Currently net short 8.1k, down 2.3k.
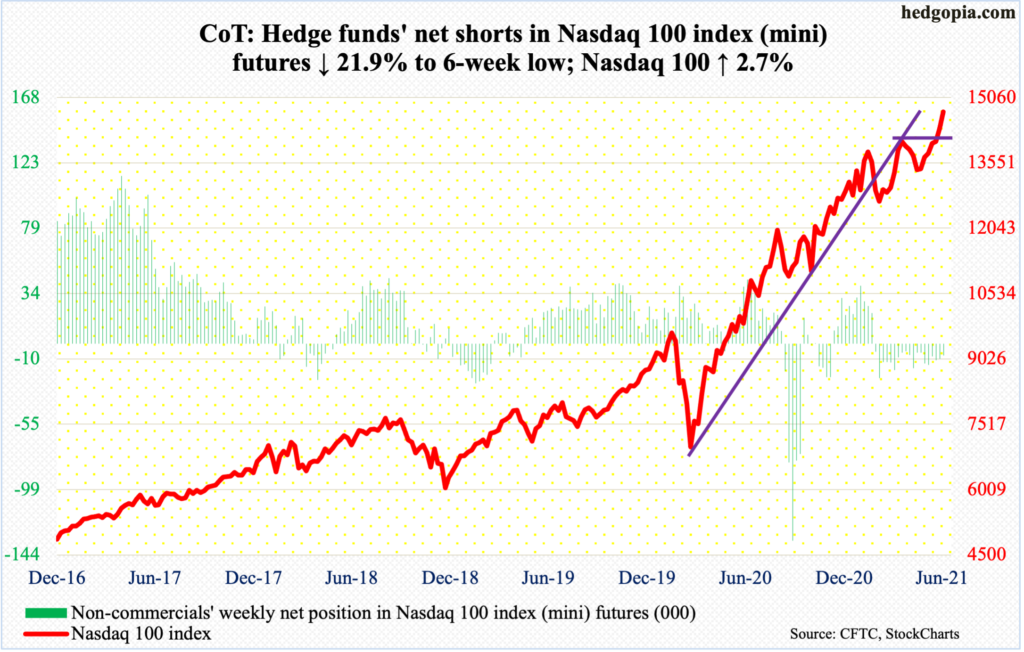
After eclipsing 14000 last week, the Nasdaq 100 further pulled away from the breakout point this week. Up 2.7 percent for the week, the tech-heavy index posted a new all-time high of 14738 on Friday, closing at 14728.
June’s 6.3-percent jump has pretty much taken care of several potentially bearish monthly candles earlier this year. May produced a hanging man, March a gravestone doji, February a dragonfly doji and January a long-legged doji.
Momentum lies with the bulls, with a breakout retest at 14000 nearly five percent away.
Russell 2000 mini-index: Currently net short 35.3k, down 2.4k.
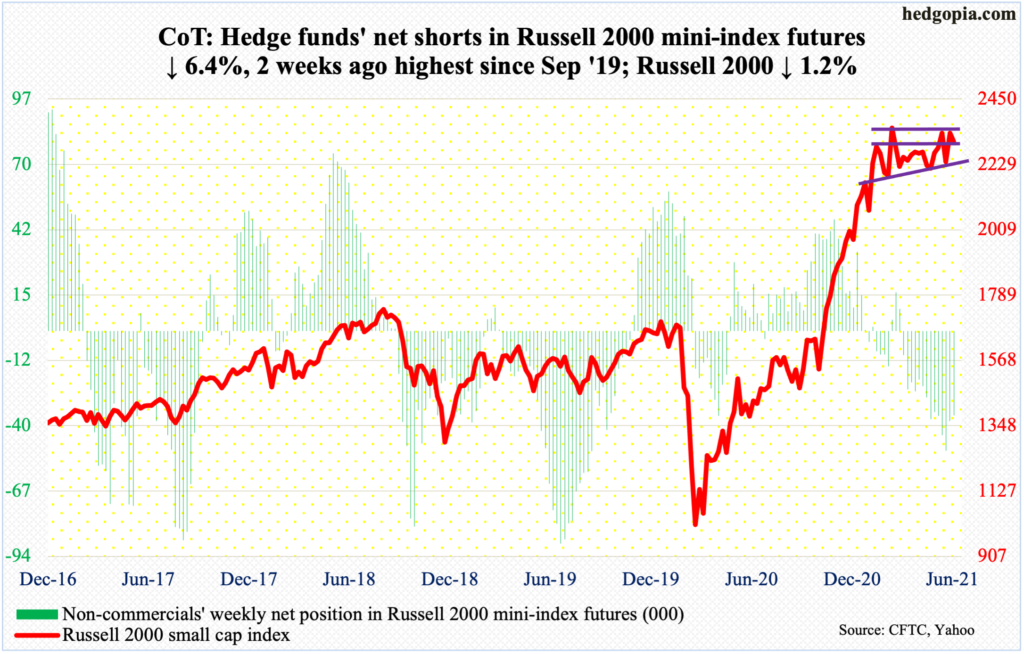
Small-caps were laggards this week. The Russell 2000 (2306) was down 1.2 percent. Support at 2280s was just about tested on Wednesday as a drop to 2295 attracted bids. But momentum off of that test was not strong enough to push through 2350s-60s, which is what the small cap index has tried to break out of for nearly four months now.
On Friday, we found out that the economy produced 850,000 non-farm jobs in June. Small-caps inherently have more domestic exposure than their larger-cap brethren. Yet the Russell 2000 shed one percent in that session. It is probably a tell.
So, for now, the index is stuck between 2280s and 2350s-60s. Either way it breaks, momentum likely follows. Breach risks are rising. Nearest support lies at 2170s, which represents six-month trend-line plus horizontal support.
There was room for short squeeze, but longs could not quite pull it off. Mid-June, IWM (iShares Russell 2000 ETF) short interest stood at 130.5 million, which was the highest since September 2015 (more on this here). In addition, non-commercials have reduced net shorts the last couple of weeks, but holdings remain large.
US Dollar Index: Currently net short 448, down 62.
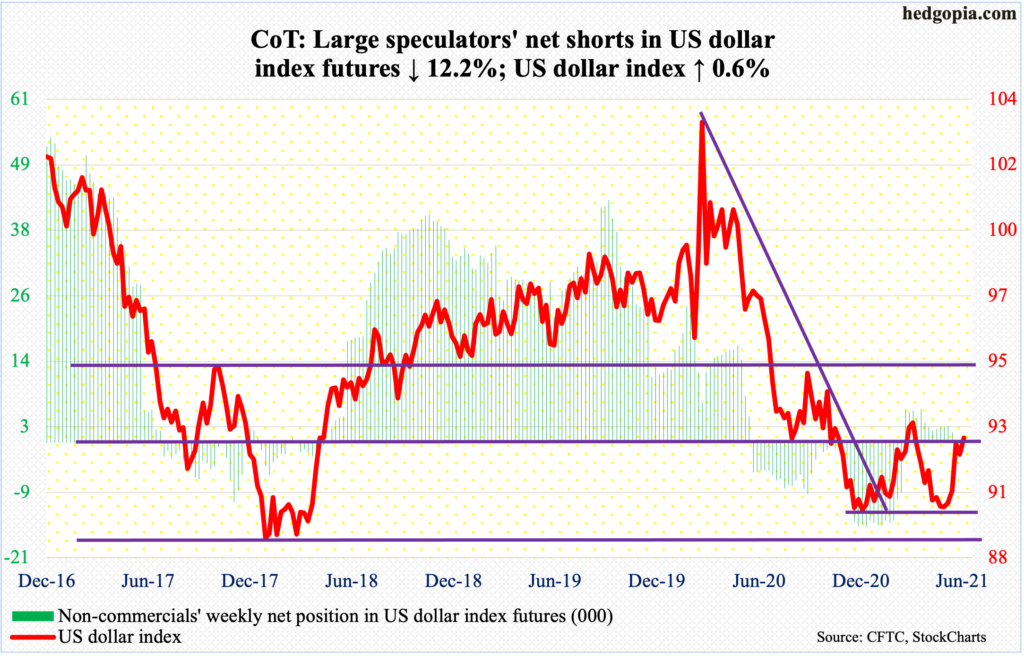
Late last week, the 200-day was successfully tested several times. This week, the US dollar index rose in each of the first four sessions. On Friday, too, it tried to rally intraday, tagging 92.76 but only to close 0.2 percent lower to 92.41.
The index rallied nicely after bottoming at 89.52 on May 25. Dollar bulls would have loved to see a higher high; the prior high was 93.47 from March 31. They may have to wait for now.
The daily is overbought. The index is still above crucial support just north of 92, which was tested on Friday; another test seems imminent. The 200-day lies at 91.53.
VIX: Currently net short 66.7k, up 4.9k.
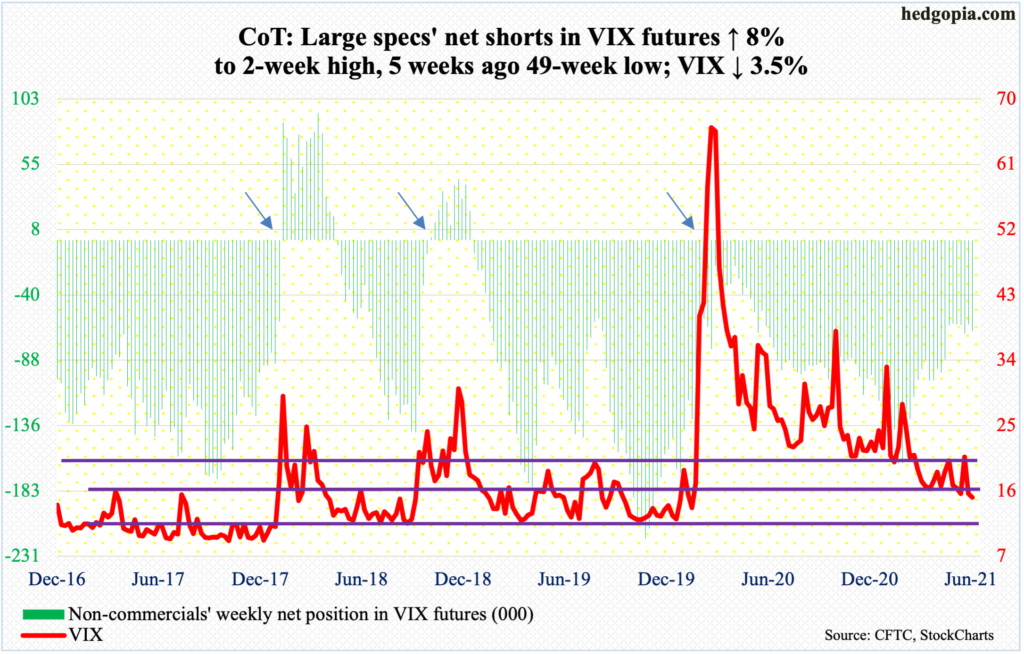
Yet another lower low this week as Tuesday’s 14.10 undercut last Thursday’s low by 0.09 points. Both those sessions saw candles with long lower shadows. This again occurred on Friday as VIX printed 14.25 intraday to successfully test the daily lower Bollinger band, closing at 15.07. This is small consolation to volatility bulls that have struggled to rally on a sustained basis.
The volatility index has been posting a series of lower highs, a pattern in place since it peaked at 85.47 in March last year. Its most recent high was set at 25.96 on May 19, followed by 21.82 on June 21.
At this stage, volatility bears are probably eyeing the 13 handle. The last time VIX dropped that low was February last year – just before a massive four-week surge.
Disclaimer: This article is not intended to be, nor shall it be construed as investment advice. Neither the information nor any opinion expressed here constitutes an offer to buy or sell any ...
more


